kubectl get pods --namespace=kube-system | grep kube-state
and create it if needed (by default it will not be there)
git clone https://github.com/kubernetes/kube-state-metrics.git kube-state-metrics
kubectl create -f kube-state-metrics/kubernetes
kubectl get pods --namespace=kube-system | grep kube-state
Note: This is mostly the default Guestbook example from https://github.com/kubernetes/examples/blob/master/guestbook/all-in-one/guestbook-all-in-one.yaml
We added an ingress that preserves source IPs and added ConfigMaps for the Apache2 and Mod-Status configs so that we could block the /server-status endpoint from outside the internal network. We also added a redis.conf to set the slowlog time criteria.
kubectl create -f guestbook.yaml
kubectl get pods -w
Port-forward port 80:
sudo kubectl port-forward service/frontend 80
Open a browser to http://localhost/ and make some entries in the sample application.
Open a browser to http://localhost/foo (this will return page not found)
kubectl create -f filebeat-kubernetes.yaml
kubectl create -f metricbeat-kubernetes.yaml
kubectl create -f packetbeat-kubernetes.yaml
If you are using the Elastic Kibana Helm Chart, then find your Kibana service and port-forward:
kubectl port-forward deployment/kibana-kibana 5601
Open your Kibana URL and look under the Dashboard link, verify that the Apache and Redis dashboards are populating.
List the existing deployments:
kubectl get deployments

NAME           DESIRED   CURRENT   UP-TO-DATE   AVAILABLE   AGE
frontend       3         3         3            3           3m
redis-master   1         1         1            1           3m
redis-slave    2         2         2            2           3m
Scale the frontend down to two pods:
kubectl scale --replicas=2 deployment/frontend

deployment "frontend" scaled
Check the frontend deployment:
kubectl get deployment frontend

NAME       DESIRED   CURRENT   UP-TO-DATE   AVAILABLE   AGE
frontend   2         2         2            2           5m
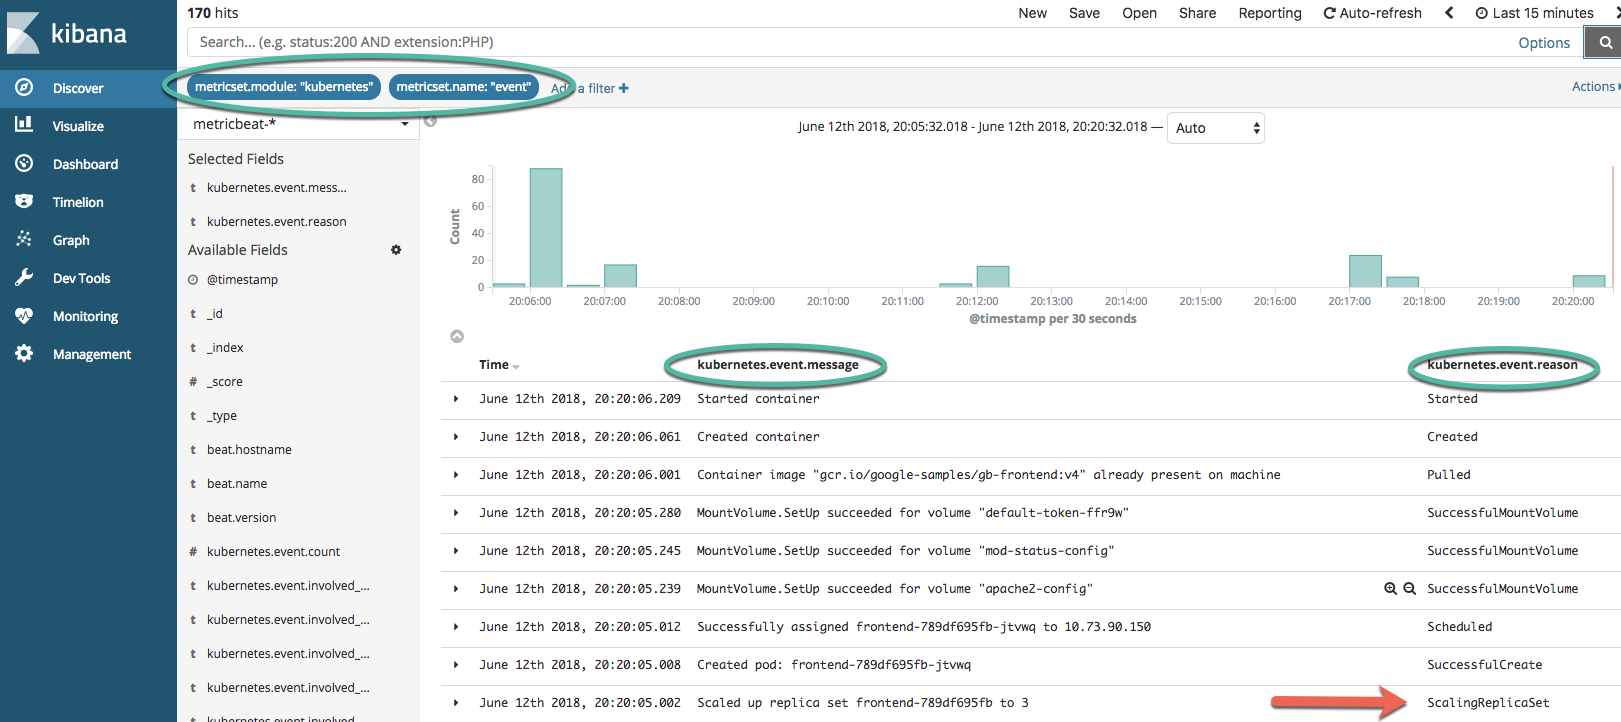
See the screenshot, add the indicated filters and then add the columns to the view. You can see the ScalingReplicaSet entry that is marked, following from there to the top of the list of events shows the image being pulled, the volumes mounted, the pod starting, etc.