This page explains how to install and execute the BFG-PCA codes. If you have any questions, please don't hesitate to post a question in the Discussions.
Please make sure you have appropriate Python and pip before starting.
Python version >=3.5
pip    version >= 1.1.0
Dependencies :
numpy  version >=1.19
tqdm   version >=2.2.4
To install these pakcages, first clone this repository by
git clone https://github.com/DanYamamotoEvans/BFG-PCA.gitNext, go to the location of the BFG-PCA folder in the terminal, and install the dependencies by
pip install .Other core programs to install:
pip install jupyterlab- Commandline BLAST+
Follow the instruction manual for installation. Set the PATH of the binary file.
Execute the following to see if installation is complete.
blastn -helpThis script was built to perform experimental plans and data analysis for Barcode Fusion Genetics screenings. There are four main steps in this suit, which I have prepared jupyter-notebooks for each.
- Monte-Carlo simulation
- Barcode calling
- Normalization
- Performance measure
- (Visualization, You will need to install R.)
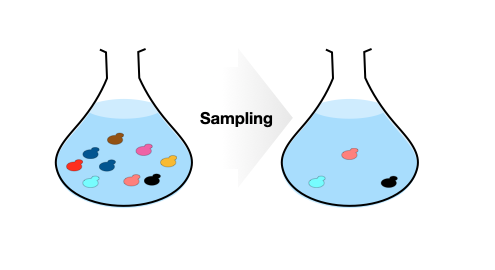
Since BFG screenings have multiple sampling steps while handling a complex pool of strains, we suimulate the sampling process with a Monte-Carlo simulation. This notebook follows the procedures of BFG screenings, and allows the user to estimate the nessesary paramaters for sampling.
When performing an experiment involving a complex pool of strains, you do not want to have any bottle necks. For example, if you have 100 strains in a flask and take only 10 cells, the chance of covering all strains are impossible. In the monte-carlo simulation provided, you can input your number of strains and see how much cells you should carry over to the next step until the sequence library preparation. Parameters are based on values in Yachie et al (2016).
This notebook creates the BLAST databse based on your barcode database file, and performs BLAST on the fastq files you provide. The results will be parsed to combine the count data.
Barcode database file (csv) A csv file with ORF and barcode information. It should have the following information. Please refer to test file for example. - Tag type (DHFR12 or DHFR3) - Category of ORF (DHFR12_XX or DHFR3_XX) - ORF Internal ID (DHFR12_001 ...) - ORF symbol. The deafult script will use 'Official Symbol Interactor' in the BioGRID downloads. Please refer to BioGRID data below. - Barcoe replicate (BC1, BC2...) - Barcode 1 sequence - Barcode 2 sequence
Index association file for demultiplexing (csv) A csv file with library information and used illumina custom indecies. It should have the following information. Please refer to test file for example. - Index (In order of Plate tag1 - Plate tag 2). Please see list of custom index as reference. Full information on primers are available in Yachie et al and/or Evans-Yamamoto et al. References at bottom of page. - Screening name - Conditon (has to be unique) - Screening replicate (if only one, put Rep1) - Experiment name - Control condition which is corresponding to this sample. By putting a * at the end it will be registered as the control condition for score normalizaition.
BioGRID data Please go to the BioGRID database, and to the downloads page. Go to curent release, and download your desired dataset in the tab3 format (e.g. BIOGRID-ALL-X.X.XXX.tab3.zip).
This notebook normalizes the count data, and compute raw PPI signals based on the barcode counts in the control condition and auto-activity level. It will also output some csv files for plotting stats.
Based on the normalized scores, this notebook computes the agreement against the BioGRID database. It will compute the agreement for various percentile values of the PPI scores generated from multiple replicates.
This notebook will help you plot the basic stats of your data from the BFG screening.
- Yachie et al, 2016 / Initial report of BFG. The codes here were built based on perl scripts provided from Dr. Nozomu Yachie.
- Evans-Yamamamto et al, 2022 / This repositry was created in part of this work to make BFG-PCA accessible.
