-
Notifications
You must be signed in to change notification settings - Fork 10
New issue
Have a question about this project? Sign up for a free GitHub account to open an issue and contact its maintainers and the community.
By clicking “Sign up for GitHub”, you agree to our terms of service and privacy statement. We’ll occasionally send you account related emails.
Already on GitHub? Sign in to your account
Adding git graphs to the materials? #50
Comments
|
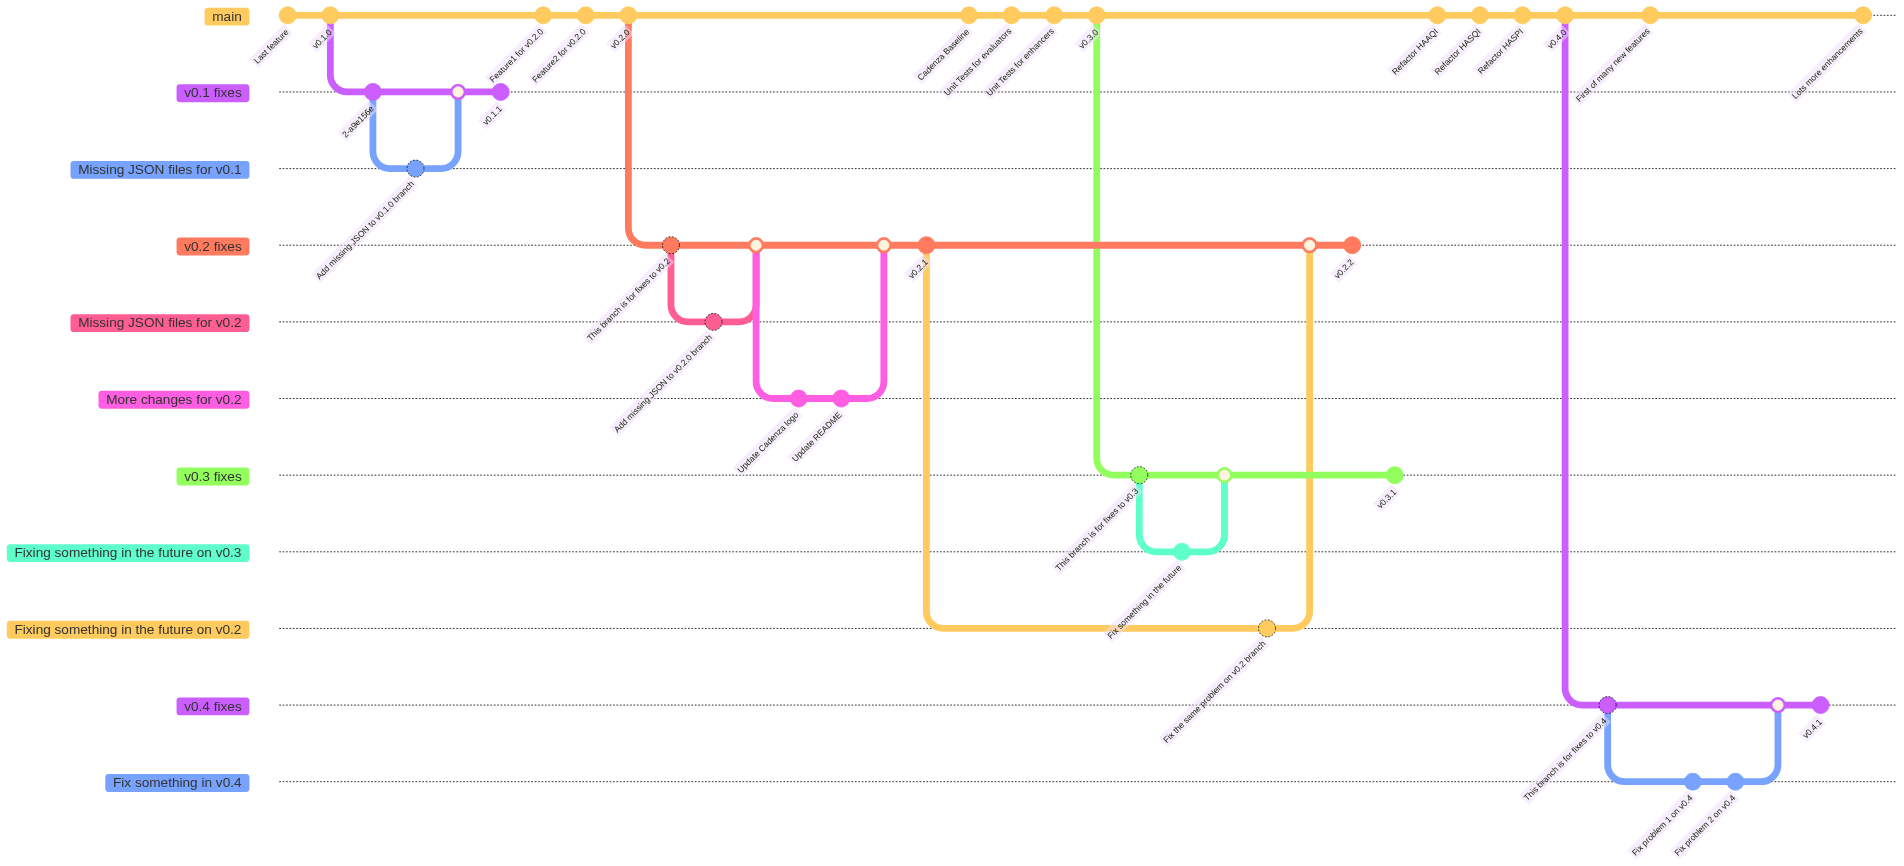
Having just done the course as a participator, I came to post this exact issue. I think the above gitgraphs (very nice!) are a welcome addition to explain the power of branching. |
|
Further using git-sim might be useful to help visualise some aspects. Most recent run of the course people were asking a lot of questions about the difference between forking and cloning. The slides do already cover this I think but animations are pretty! |
|
This can be done by leveraging mermaid.live which once you've constructed your graph provides a link to embed it in Markdown under the Action button on the bottom left, it provides... [](https://mermaid.live/edit#pako:eNqlVl1v2jAU_SuWJcQLQ4kTKMkb68fWqV23frxMvJjkBqwmNnKcjhbx33eTkAloUgglD9jxOdfHvuc6XtFAhUB92umshBTGJ6uumUMCXZ90pzyFbo90Z8J803wx7-ajWhlu4FwliTA3fAoxvjU6g_VEkuqH7XWnU76oyP-Hg4JKROiTCb3hqSERcJNpmNB6zIvVt_vW1uhUcxnMNyMkEktI33Mn9HEu0gqLrUjpEkuMIjmzLuKtSFMhZ-THw91PRMdQ8vbgO_LGYUiSbdomfN_ahN0mziF4Vplp0p6AnsFpMoop7bq5Ei5kPeeq3Hi7Cs52trkOyo6AvhvdzhdrylfJPZAz1i5nrGXO2OGcsRNyVq9aacDYXM6O0Pu0CLHoyDkPQb5xEquZOgC9vxxf3F6esow2uoo9a2m6ahFf8XSJhWws-yc8jsgjpKaUAS88zrhROj2WIHERATTjUbzT6FPnUz516qJeiWXuj1QlYOZ5S0iCZy2JsryyiJL7zN0CFMsmamOWncYst9dywD7tVsk-WmWOTnkCZKHVNIak4pxemp_TVJictdjk9y5rWSL3EPEArU6-j8e_r5sib6EejkP9uv5ApdtYC-6nasGt37li9Y0u0HgtUBFukXwlEv5WV4S0MQvuh47cTf2-qH0DVr6zN844CszqwAckbvnzeIVFqloa6kbhoZjkJ_vmVExAGlRCexQ1IC_EK-Aq505ocf2b0JwWcv2cT7RGXFZ8Vy5DgV6ifn7j61GeGfXwKoOqX2IuBJ9pnlQvF1z-UQq7EY_Tsk_9FV1S_4s7svre4Awfy3OHbDQa9Ogr9YdWf2ixgWfZtufhn7fu0bciBH6gmWs5o4HtDJyh552t_wG-Kjr8)Which renders as... |

Feel free to disagree! (also could move this to GH discussions if we think it would be beneficial)
I think that a couple of additional visuals would help me personally when delivering this training to illustrate some of the concepts around commits and branches.
In the advanced collaboration section, I wonder if we could do with a diagram that shows branching a bit more visually.
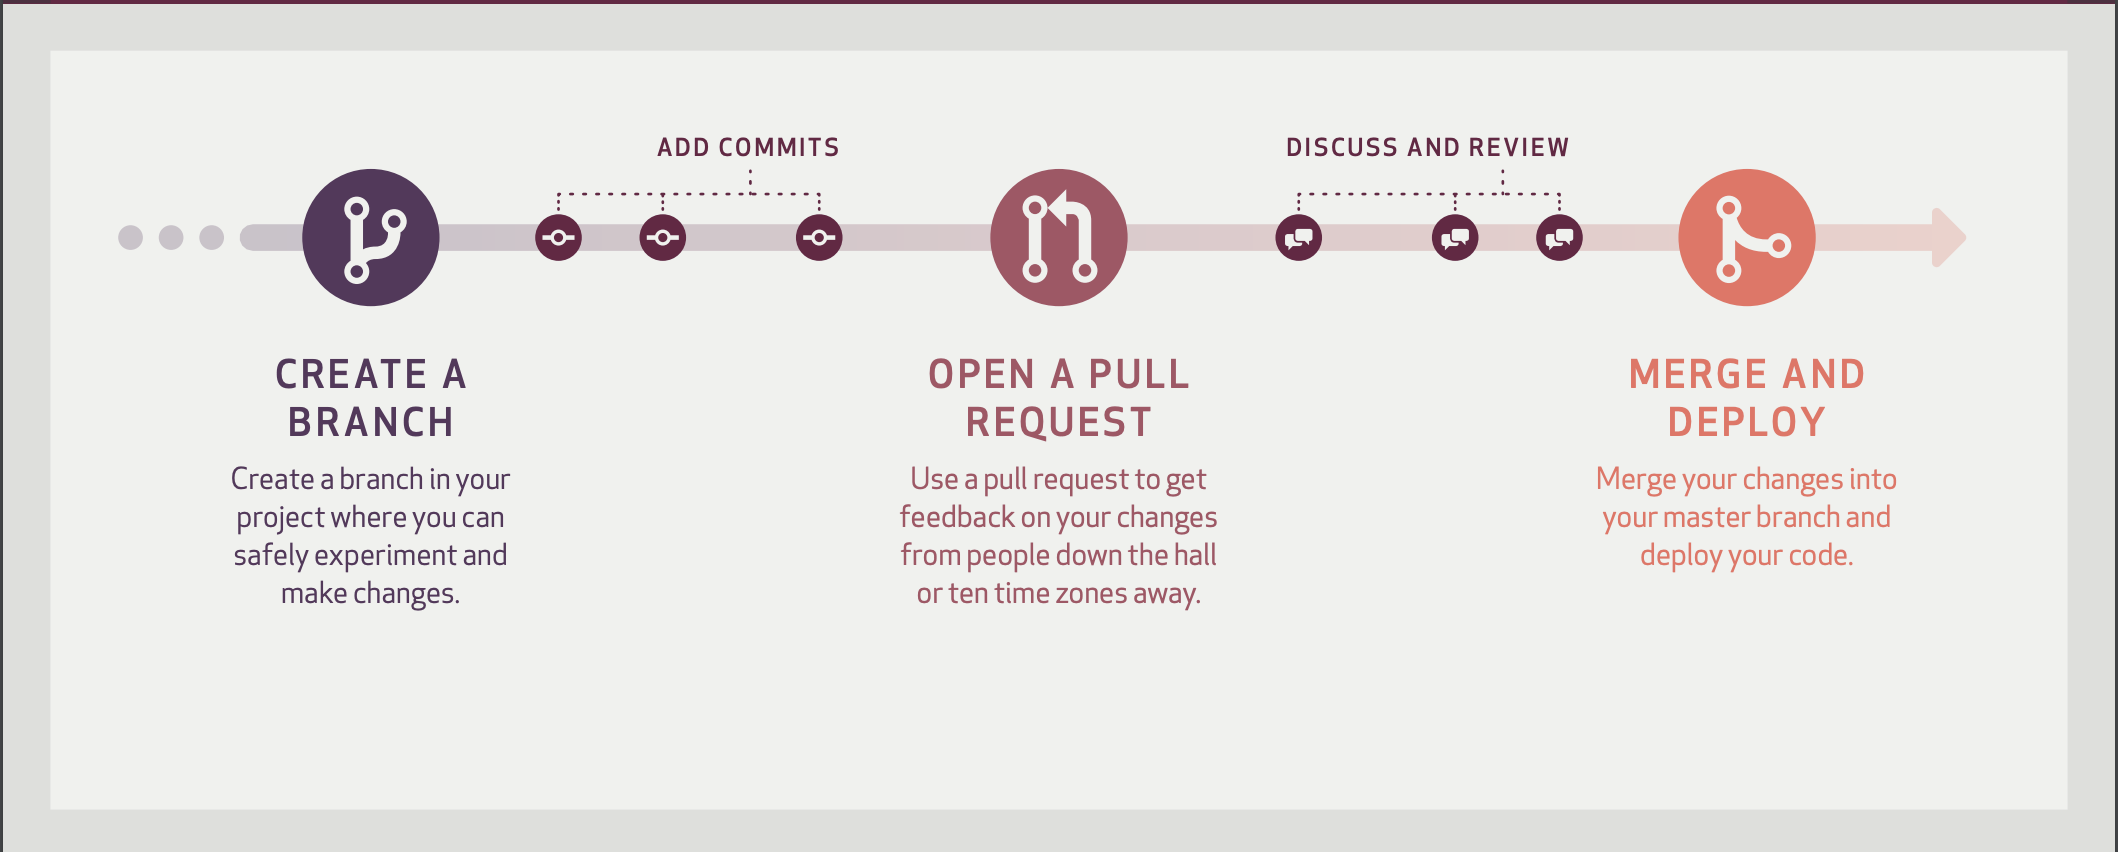
The current diagram we have here:

does a good job illustrating the flow IMO, but doesn't visually show the branching concept.
We could add something like the following to show branching a bit more clearly.
gitGraph commit commit commit commit commit branch feature checkout feature commit commit checkout main(aside: check out this sweet mermaid gitgraph feature)
Which could then be extended to show the pull request and merge steps, e.g.
gitGraph commit commit commit commit commit branch feature checkout feature commit commit checkout main merge featureI'd be interested to know others' thoughts on this.
The text was updated successfully, but these errors were encountered: