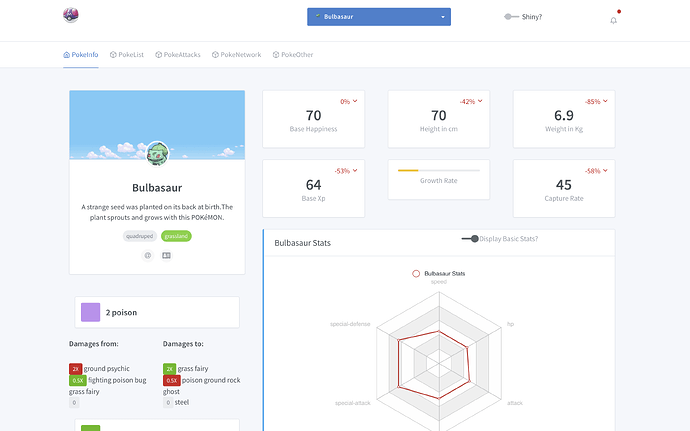
Tabler dashboard template for shiny with Bootstrap 4
See https://tabler.io for the original template.
This package is on CRAN:
# latest devel version
devtools::install_github("RinteRface/tablerDash")
# CRAN version
install.packages("tablerDash")library(shiny)
library(tablerDash)
library(echarts4r)
library(shinyWidgets)
library(magrittr)
library(palmerpenguins)
# datas flowGl
vectors <- expand.grid(x = -3:3, y = -3:3)
mu <- 1
vectors$sx <- vectors$y
vectors$sy <- mu * (1 - vectors$x^2) * vectors$y - vectors$x
vectors$color <- log10(runif(nrow(vectors), 1, 10))
# cards
flowCard <- tablerCard(
title = "FlowGl Chart",
closable = FALSE,
zoomable = TRUE,
options = tagList(
tablerAvatar(status = "lime", url = "https://preview.tabler.io/static/avatars/000m.jpg")
),
width = 12,
echarts4rOutput("flowGl"),
footer = tablerTag(name = "build", addon = "passing", addonColor = "success")
)
profileCard <- tablerProfileCard(
width = 12,
title = "Dyann Escala",
subtitle = "Mechanical Systems Engineer",
src = "https://preview.tabler.io/static/photos/finances-us-dollars-and-bitcoins-currency-money.jpg",
tablerSocialLinks(
tablerSocialLink(
name = "facebook",
href = "https://www.facebook.com",
icon = "facebook"
),
tablerSocialLink(
name = "twitter",
href = "https://www.twitter.com",
icon = "twitter"
)
)
)
# app
shiny::shinyApp(
ui = tablerDashPage(
navbar = tablerDashNav(
id = "mymenu",
src = "https://raw.githubusercontent.com/tabler/tabler/dev/src/static/logo.svg",
navMenu = tablerNavMenu(
tablerNavMenuItem(
tabName = "Home",
icon = "home",
"Home"
),
tablerNavMenuItem(
tabName = "Test",
icon = "box",
"Test"
)
),
tablerDropdown(
tablerDropdownItem(
title = "Item 1 title",
href = "https://google.com",
status = "danger",
date = "now",
"This is the first dropdown item"
),
tablerDropdownItem(
status = "warning",
"This is the second dropdown item",
date = "yesterday"
),
tablerDropdownItem(
title = "Item 3 title",
"This is the third dropdown item"
)
)
),
footer = tablerDashFooter(
tablerIcon(name = "maestro", lib = "payment"),
tablerIcon(name = "mastercard", lib = "payment"),
copyrights = "@David Granjon, 2024"
),
title = "tablerDash",
body = tablerDashBody(
chooseSliderSkin("Modern"),
tablerTabItems(
tablerTabItem(
tabName = "Home",
fluidRow(
column(
width = 4,
profileCard,
numericInput(
inputId = "totalStorage",
label = "Enter storage capacity",
value = 1000),
uiOutput("info")
),
column(
width = 8,
flowCard
)
),
fluidRow(
column(
width = 8,
tablerCard(
status = "primary",
statusSide = "top",
width = 12,
tablerTimeline(
tablerTimelineItem(
title = "Item 1",
status = "green",
date = "now"
),
tablerTimelineItem(
title = "Item 2",
status = NULL,
date = "yesterday",
"Lorem ipsum dolor sit amet,
consectetur adipisicing elit."
)
)
)
),
column(
width = 4,
tablerStatCard(
value = 43,
title = "Followers",
trend = -10,
width = 12
)
)
)
),
tablerTabItem(
tabName = "Test",
tablerCard(
title = "Plots",
plotOutput("distPlot"),
status = "info",
statusSide = "left",
width = 12,
footer = tagList(
column(
width = 12,
align = "center",
sliderInput(
"obs",
"Number of observations:",
min = 0,
max = 1000,
value = 500
)
)
)
),
tablerCard(
title = "Tables",
selectInput(
"variable",
"Variables to show:",
choices = colnames(penguins),
selected = colnames(penguins),
multiple = TRUE
),
tableOutput("data"),
width = 12,
overflow = TRUE
),
tablerCard(
width = 12,
echarts4rOutput("gauge", height = "300px"),
sliderInput(
"gaugeVal",
"Gauge Value:",
min = 0,
max = 100,
value = 50
)
)
)
)
)
),
server = function(input, output) {
output$distPlot <- renderPlot({
hist(rnorm(input$obs))
})
output$data <- renderTable({
penguins[, input$variable, drop = FALSE]
}, rownames = TRUE)
output$flowGl <- renderEcharts4r({
vectors %>%
e_charts(x) %>%
e_flow_gl(y, sx, sy, color) %>%
e_visual_map(
min = 0, max = 1, # log 10
dimension = 4, # x = 0, y = 1, sx = 3, sy = 4
show = FALSE, # hide
inRange = list(
color = c('#313695', '#4575b4', '#74add1', '#abd9e9', '#e0f3f8',
'#ffffbf', '#fee090', '#fdae61', '#f46d43', '#d73027', '#a50026')
)
) %>%
e_x_axis(
splitLine = list(show = FALSE)
) %>%
e_y_axis(
splitLine = list(show = FALSE)
)
})
output$info <- renderUI({
tablerInfoCard(
width = 12,
value = paste0(input$totalStorage, "GB"),
status = "success",
icon = "database",
description = "Total Storage Capacity"
)
})
output$gauge <- renderEcharts4r({
e_charts() %>%
e_gauge(as.numeric(input$gaugeVal), "%")
})
}
)Issues are listed here.
Please note that the tablerDash project is released with a Contributor Code of Conduct. By contributing to this project, you agree to abide by its terms.


