- Getting Started
- Running the tests
- Mochi
- Writing Tests
- Debugging Intermittents
- Troubleshooting Test Harness
We use mochitests to do integration testing. Mochitests are part of Firefox and allow us to test the debugger literally as you would use it (as a devtools panel).
Mochitests are different from Jest, Mocha, Selenium, because we have access to firefox internals and run inside the browser toolbox. This makes it possible to write tests as if we're a user interacting with the debugger natively :)

Requirements
- mercurial (
brew install mercurial) - autoconf213 (
brew install [email protected] && brew unlink autoconf)
Setup Firefox
- Inside the main debugger.html folder run:
./bin/prepare-mochitests-dev
This command will either clone mozilla-central (the firefox repo) or update it.
It also sets up a symlink for the tests so that changes in src/test/mochitest are
reflected in the new firefox directory.
yarn watchcopies new bundles into the firefox directoryyarn mochiruns the tests in a second process
mochi passes its params along to mochitest, so you can include --jsdebugger and test globs
yarn mochi dbg-editor-highlightruns just one testyarn mochid dbg-editor-highlightopens a browser toolboxyarn mochih dbg-editor-highlightruns the test headlessly
Here are a few tips for writing mochitests:
- There are lots of great helper methods in head
- Try to write async user actions that involve a user action like clicking a button or typing a key press followed by a redux action to listen for. For example, the user step in action involves the user clicking the step in button followed by the "stepIn" action firing.
- The
dbgobject has several helpful properties (actions, selectors, getState, store, toolbox, win)
If you're looking for some tutorials on how to write and debug mochitests
The mochitests run in a special environment, which make console.log a little different than usual.
console.log inside the test will print to the terminal. console.log in the debugger source, will be redirected to the browser console and will not be outputed. This is why we recommend using the special firefox dump call which is available everywhere.
If you want a convenience method for logging in the test, log is a bit cleaner than dump.
console.log(">>> YO");
log("FOO", { t: 3 });
dump(">> FOOO\n");There are two ways to pause the tests and see what is going on.
The first is to add a debugger statement to the test and run yarn mochid {test_name} (ex: dbg-sources). Here you'll have to click a modal when the test opens. When the test pauses, the browser toolbox will show your test with the dbg object you can interact with.
The other way is to add await waitForever() to your test. This stops the test and gives you a chance to interact with the debugger as the user would. Both ways of pausing are useful for different use cases!
It's really common to want to wait for something to happen in a test. Generally we wait for one of two things to happen:
- waiting for the Redux state to change
- waiting for an action to be dispatched
await waitForState(dbg, state => isPaused(state));
await waitForDispatch(dbg, "STEP_OVER";)You can find common elements in the debugger with the findElement function,
which use shared selectors. You can also find any element with the
findElementWithSelector function.
findElement(dbg, "sourceNode", 3);
findElementWithSelector(dbg, ".sources-list .focused");If you want to evaluate a function in the debuggee context you can use
the invokeInTab function. Under the hood it is using ContentTask.spawn.
invokeInTab(dbg, "doSomething");ContentTask.spawn(gBrowser.selectedBrowser, null, function*() {
content.wrappedJSObject.foo();
});The above calls the function foo that exists in the page itself. You can also access the DOM this way: content.document.querySelector, if you want to click a button or do other things. You can even you use assertions inside this callback to check DOM state.
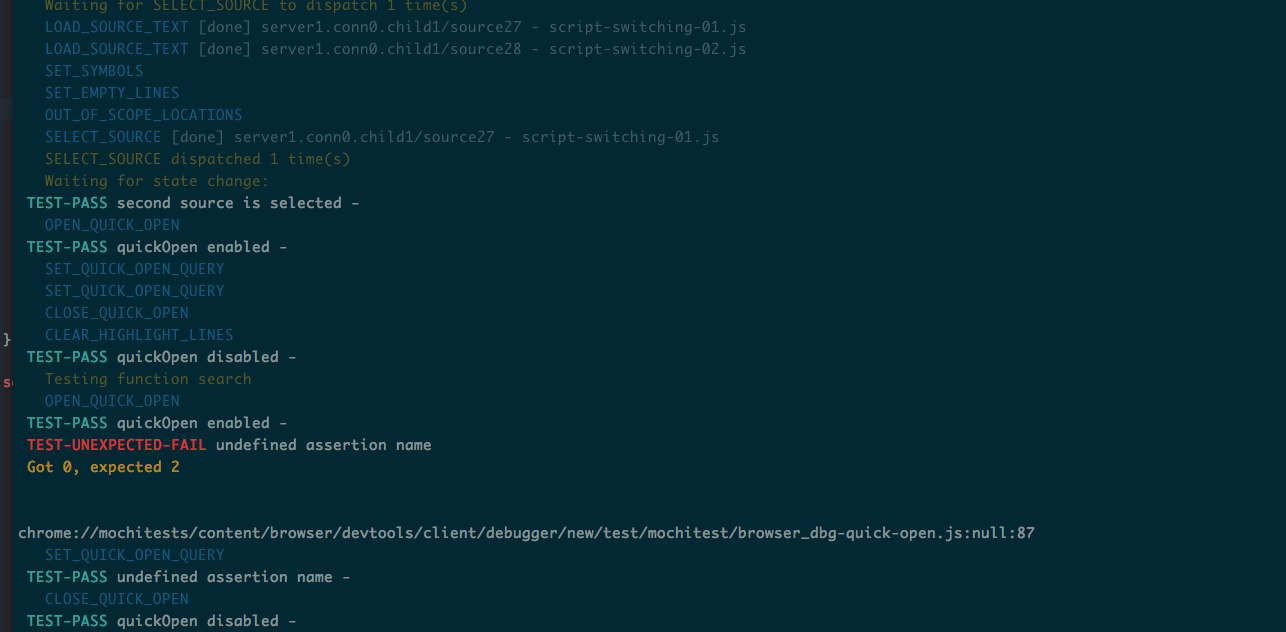
The first step for debugging an integration test is establishing a clear sequence of events: where did the test break and what were the events that preceded it.
The mochitest logs provide some context:
- The actions that fired
- Assertion Passes/Failures
- Events that the test waited for: dispatches, state changes
NOTE: it might be nice to run the tests in headless mode:
yarn mochih browser_dbg-editor-highlight
In depth walk through
The next step is to add additional logging in the test and debugger code with info calls.
We recommend prefixing your logs and formatting them so they are easy to scan e.g.:
info(">> Add breakpoint ${line} -> ${condition}\n")info(">> Current breakpoints ${breakpoints.map(bp => bp.location.line).join(", ")}\n")info(">> Symbols for source ${source.url} ${JSON.stringify(symbols)}\n")
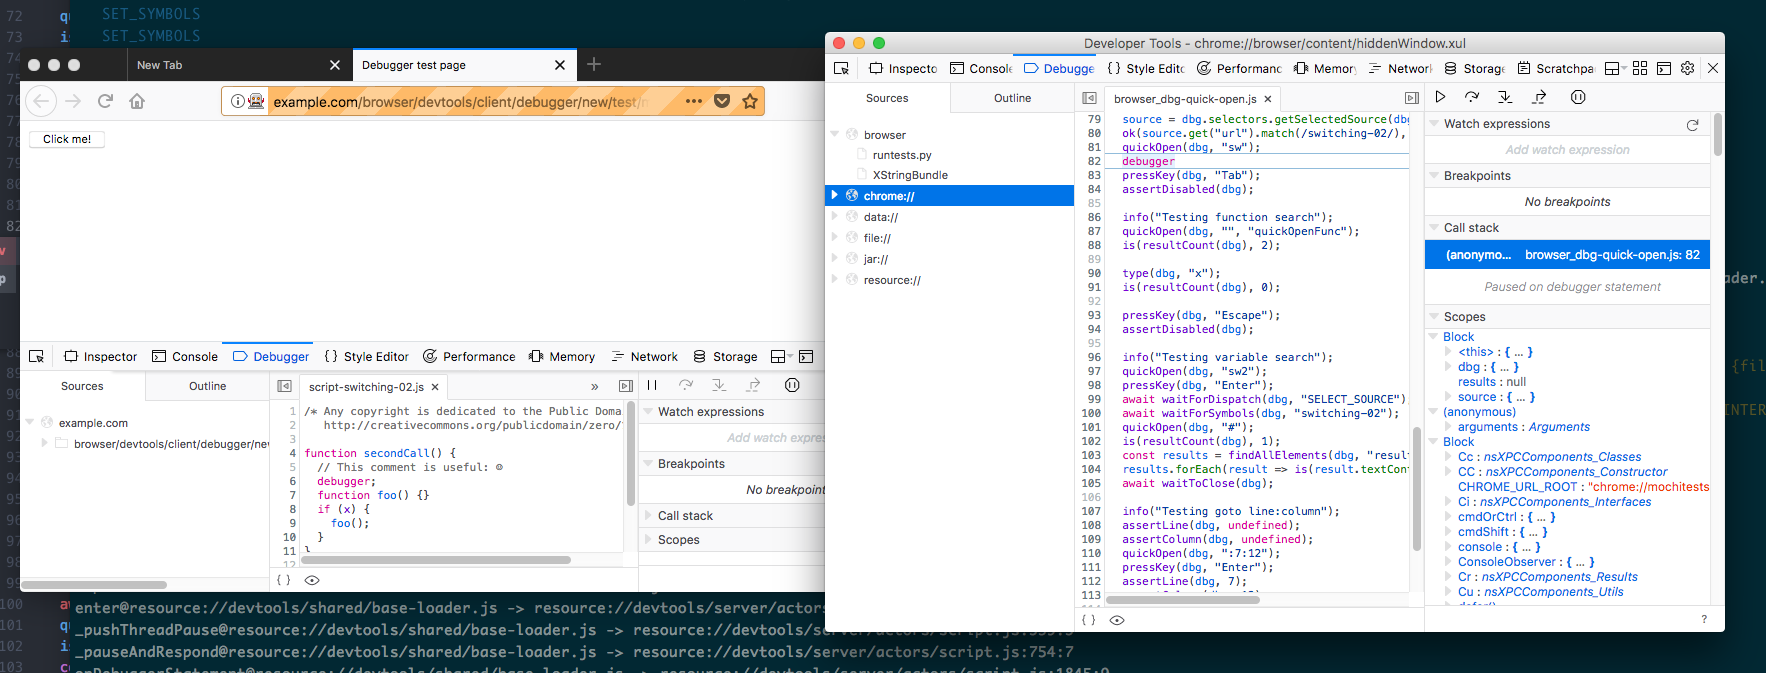
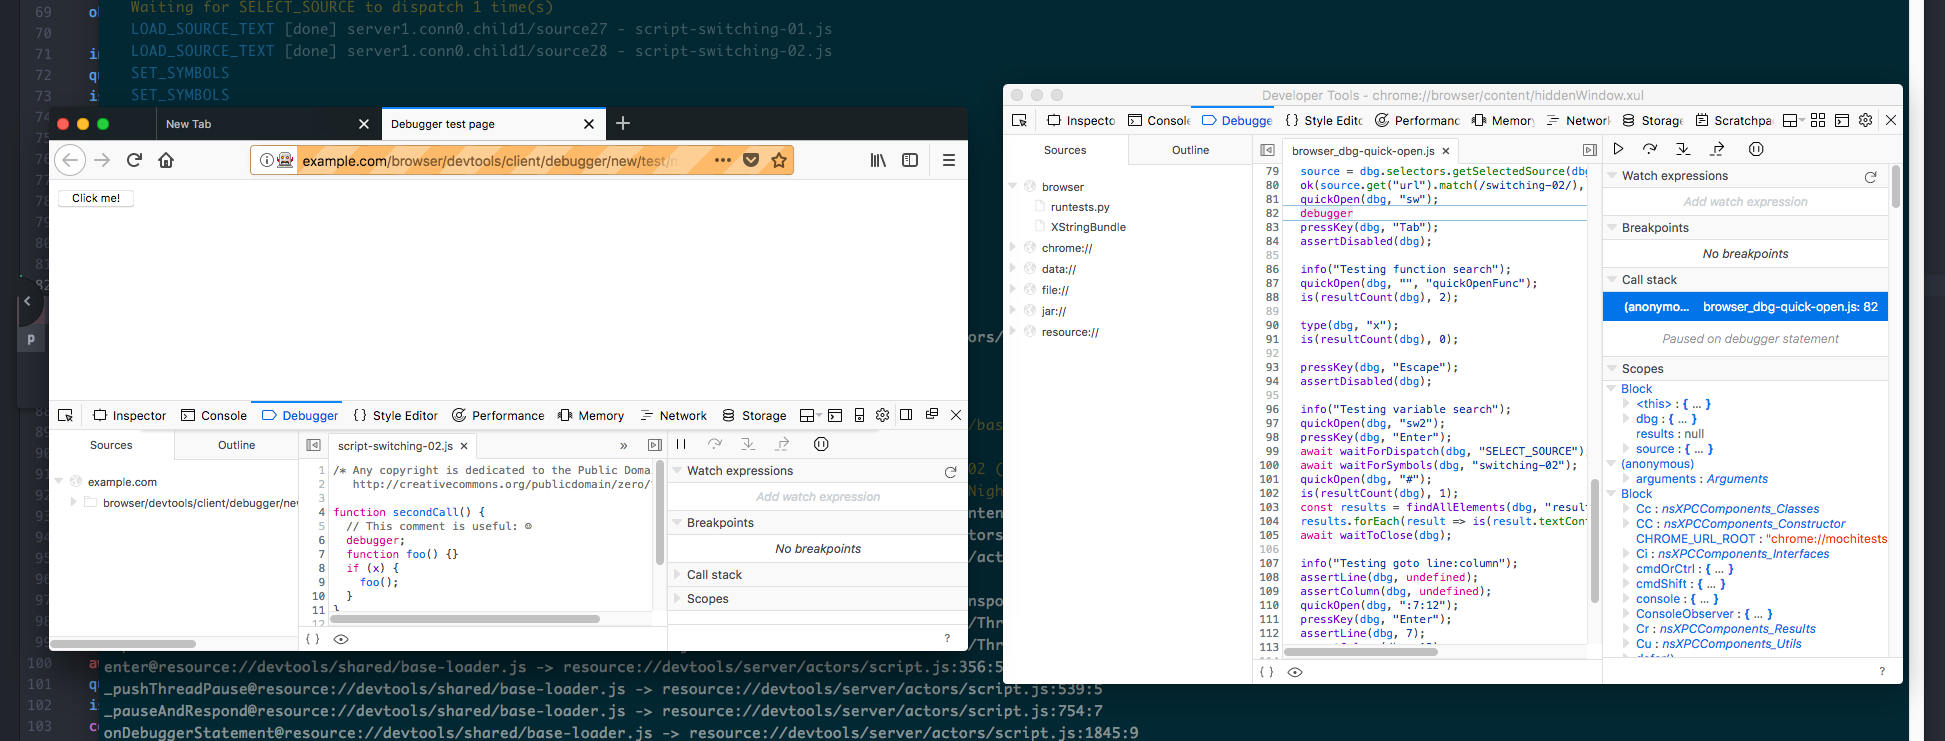
At some point, it can be nice to pause the test and debug it. Mochitest makes it easy to pause the test at debugger statements with the --jsdebugger flag.
You can run the test with yarn mochid {test_name} (ex: browser_dbg-editor-highlight).
Intermittents are when a test succeeds most the time (95%) of the time, but not all the time. There are several easy traps that result in intermittents:
- browser inconsistencies sometimes the server is not as consistent as you would like. For instance, reloading can sometimes cause sources to load out of order. Also stepping too quickly can cause the debugger to enter a bad state. A memorable example of this type of inconsistency came when debugging stepping behavior. It turns out that 1% of the time the browser toolbox will step into an unexpected location. The solution is too loosen our expectations :)
- missed actions sometimes action "B" can fire before action "A" is done. This is a race condition that can be hard to track down. When you suspect this might happen, it is a good practice to start listening for "B" before you fire action "A". Here's an example where this happened with reloading.
- state changes One common way tests start failing occurs when the redux actions introduces a new asynchronous operation. A good way to safe guard your tests is to wait on state to have certain values. An example, of a test that we recently fixed was pretty printing. The test initially waited for the "select source" action to fire, which was occasionally racey. Switching the test to wait for the formatted source to exist simplified the test tremendously.
The mochitest cli has a lot of advanced options that are worth learning about. Here is a quick intro in how it can be used
cd firefox
./mach mochitest devtools/client/debugger/new # runs all the debugger tests
./mach mochitest browser_dbg-editor-highlight # runs one test
./mach mochitest --jsdebugger browser_dbg-editor-highlight # runs one test with the browser toolbox open
Visit the mochitest MDN page to learn more about mochitests and more advanced arguments. A few tips:
The detailed instructions for setting up your environment to build Firefox for Windows can be found here. You need to install the latest MozBuild package. You can open a unix-flavor shell by starting:
C:\mozilla-build\start-shell.bat
In the shell, navigate to the debugger.html project folder, and follow the Getting Started instructions as mentioned.
The mochitest are running against the compiled debugger bundle inside the Firefox checkout. This means that you need to update the bundle whenever you make code changes. prepare-mochitests-dev does this for you initially, but you can manually update it with:
yarn copy-assets
That will build the debugger and copy over all the relevant files into firefox, including mochitests. If you want it to only symlink the mochitests directory, pass --symlink-mochitests (which is what prepare-mochitests-dev does).
It's annoying to have to manually update the bundle every single time though. If you want to automatically update the bundle in Firefox whenever you make a change, run this:
yarn copy-assets-watch
Now you can make code changes the bundle will be automatically built for you inside firefox, and you can simply run mochitests and edit code as much as you like.
If you add new tests, make sure to list them in the browser.ini file. You will see the other tests there. Add a new entry with the same format as the others. You can also add new JS or HTML files by listing in under support-files.
In addition to the standard Mochitest API, we provide the following functions to help write tests. All of these expect a dbg context which is returned from initDebugger which should be called at the beginning of the test. An example skeleton test looks like this:
add_task(function*() {
  const dbg = yield initDebugger("doc_simple.html", "code_simple.js");
  // do some stuff
  ok(state.foo, "Foo is OK");
});
The Debugger Mochitest API Documentation can be found here.
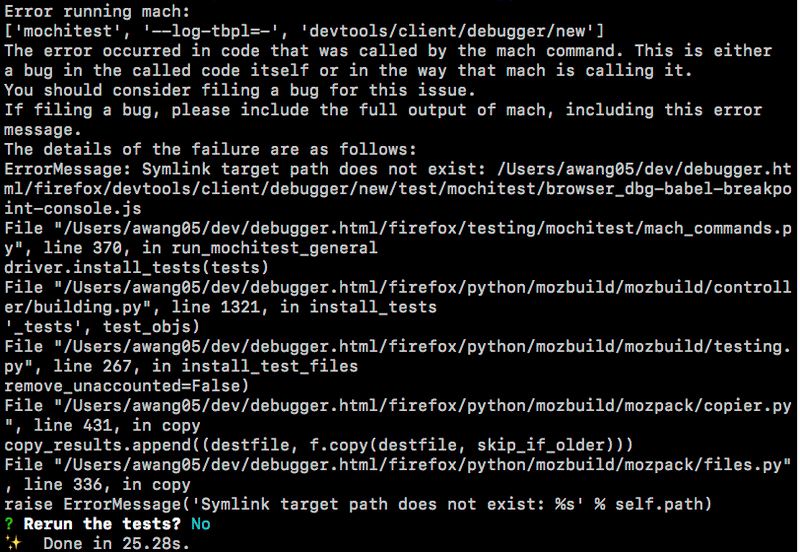
If symbolic link is suddenly lost between debugger.html and Firefox source, in your terminal, try the following
- Navigate to the firefox directory (i.e.
cd ~/debugger.html/firefox) - Execute
./mach mochitest --headless devtools/client/debugger/new
If a symbolic link occurs, error message(s) will be displayed.
- Execute
./bin/prepare-mochitests-dev.
Running this command again allows the preparation script to check the integrity of the firefox directory and all symbolic
links. It will then automatically execute yarn copy-assets-watch on your behalf, which ensures the symbolic linking process
is complete.
-
On a new terminal tab, execute the command to run your test again. If this failed, proceed to step 5.
-
Execute
./mach configure
This will attempt to fix the harness' configurations.
If you are having issues running mochitest due to missing the Rust compiler, try the following:
-
In the root directory of the project (i.e.
debugger.html/), execute./mach configure. -
Execute
yarn copy-assets-watch -
Open a new terminal tab and run your tests again. If this failed, proceed to step 4 and 5.
-
Execute
./mach bootstrap. -
Execute
./bin/prepare-mochitests-dev.
You may see warnings along the way and the process may appear to be frozen. Please be patient, this is expected as it will take a while to recompile. Warning messages does not mean the compilation process has failed.
- Repeat steps 2 and 3.