-
Notifications
You must be signed in to change notification settings - Fork 1
Progress
- Name: Karan Bhaveshbhai Kharecha
- Mentors: Jan Forberg, Luca Virgili, Krishanu Konar
- Proposal: User Centric Knowledge Engineering and Data Visualization
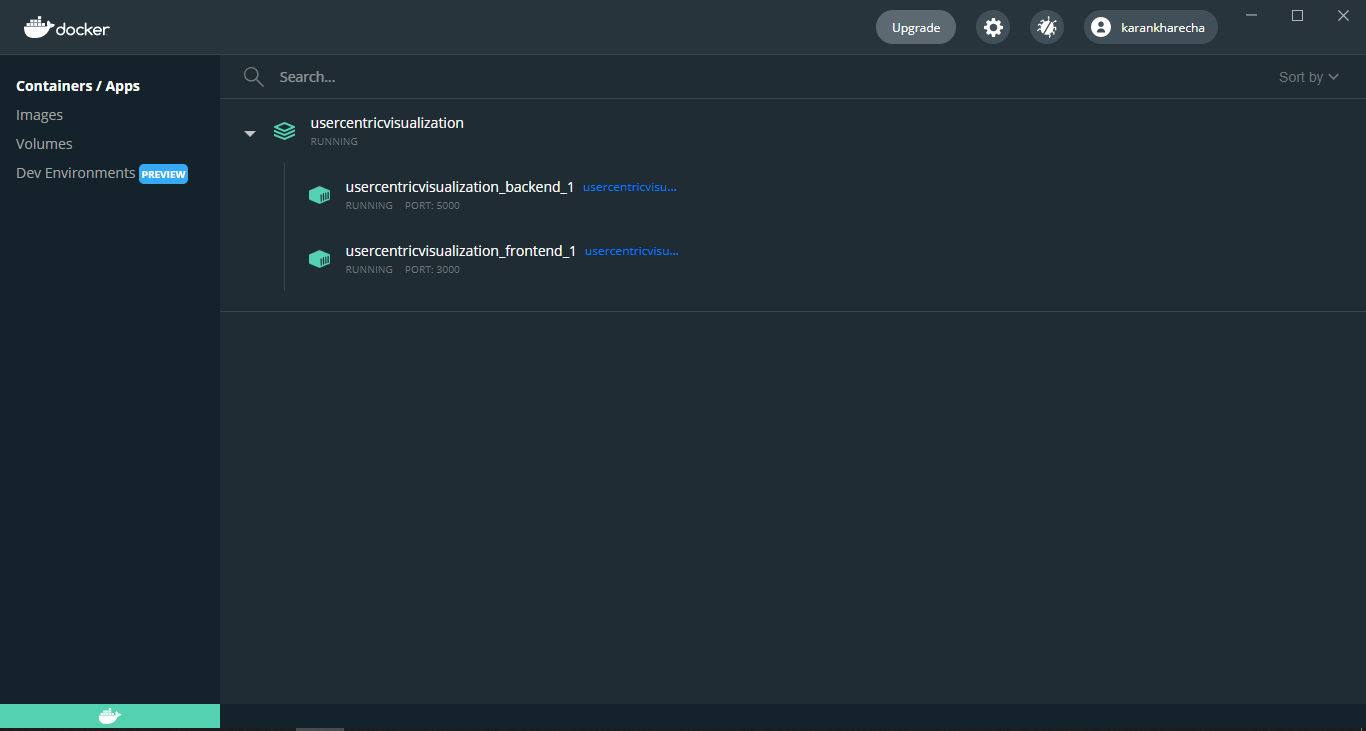
[10-August-2021]: These days, I am working on deploying the application in the form of docker containers. Hence, I have created respective Dockerfile(s) and with the help of docker-compose, I am spinning up the docker containers for backend and frontend operations. Below image shows these containers running in parallel.

[05-August-2021]: I am still working on the OIDC for flask and since the flask backend is only responsible for CRUD operations, and given the support of OIDC authentication in node.js, I am looking at the alternatives including node.js backend.
[03-August-2021]: Next step is about integrating the OIDC authentication.
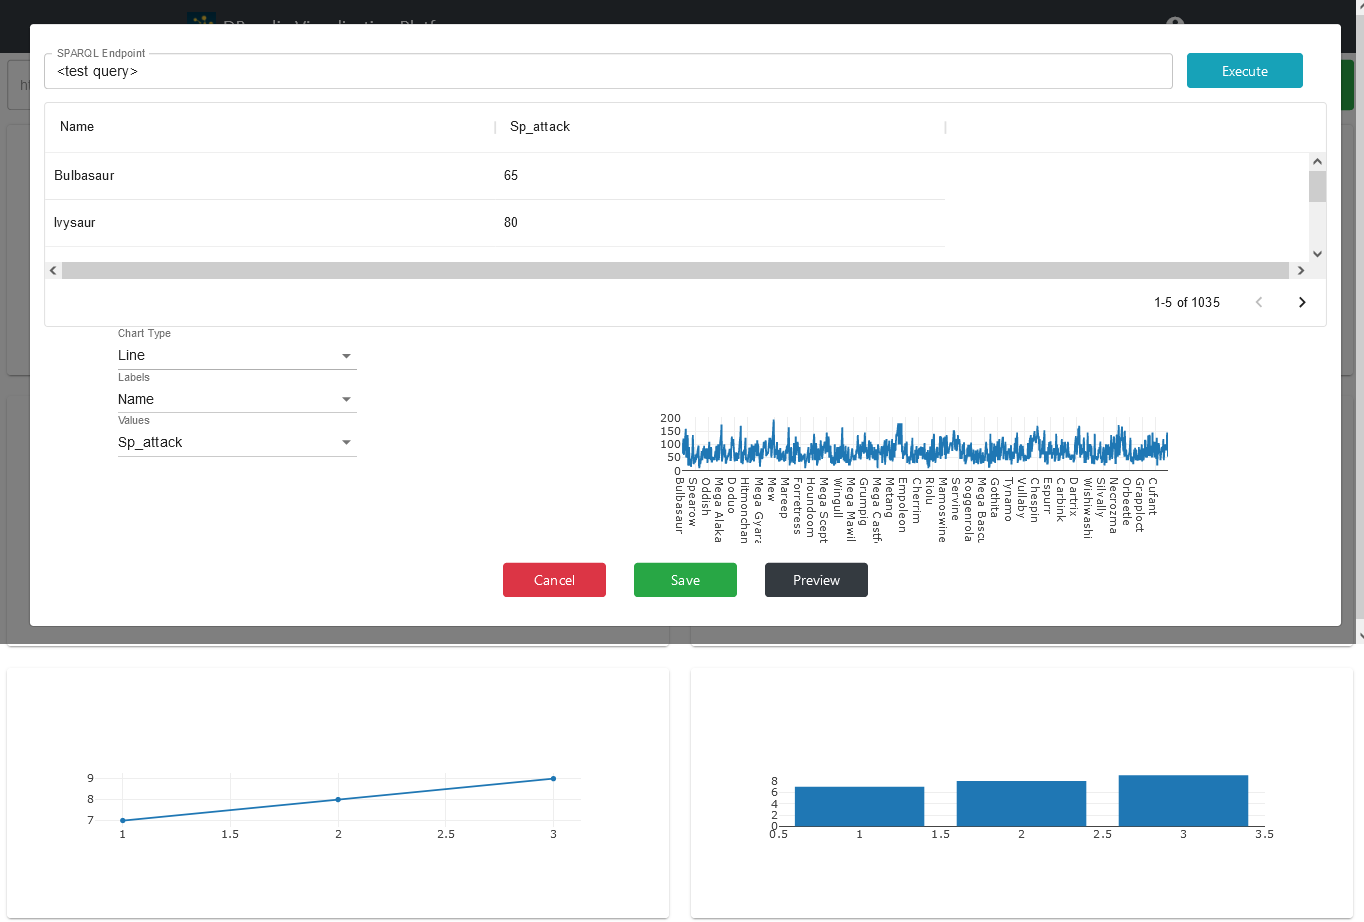
[30-July-2021]: I successfully integrated YASQE editor in place of simple query editor. The current YASQE editor allows users to have multiple tabs and execute multiple SPARQL queries on different endpoints. Using this editor, users can also set the response type and can filter the results as they want. As the editor is official SPARQL editor, it also shows the error messages if queries are incorrectly written. Below image shows the YASQE editor on the pop up window for adding the block on the dashboard.

[27-July-2021]: I added the indicators that shows the loading of dashboards or any operations that take time to complete load. Below screenshot shows the loading indicators for loading one of the saved dashboards. The loading operation here is the set of SPARQL queries that are executed and results are fetched in order to visualize.

[22-July-2021]: These days, I was working on understanding about implementation of the YASQE for querying the SPARQL endpoint. The current simple query editor was to be replaced by the YASQE and hence reading its documentation and collecting information for the implementation.
[20-July-2021]: I had a meeting with my mentors to show my current progress regarding visualization retrievals. After the meeting, there were several points for improvements like layout of the block (editor), displaying error messages, caching, and also including the SPARQL query editor YASQE
[15-July-2021]: The next step after saving the blocks was to retrieve them from the database and load them on the dashboard. This includes loading the dashboard when the new block is added to reflect the new change immediately without manually refreshing the page. Below images show the dashboard load and the blocks that are saved along with the visualization type.

[12-July-2021]: I completed the functionality to saving the blocks of the dashboard and savings multiple dashboard instances for a single user.

[08-July-2021]: I implemented the functionality for a user to visualize the data by executing the query. For this, plotly.js library has been used in the frontend and SPARQLWrapper in the backend to execute the SPARQL queries on the user specified endpoint.
[06-July-2021]: I had a meeting with my mentors to discuss about the authentication issues of user login. The issue was related to dependency version of keycloak-js.
[02-July-2021]: By this time, I have added the "persistent layer" for one user to create the dashboards and save them in order to get the same ones after re-login. The next step is to add few functionalities for deleting the dashboards as well, along with the blocks that are inside of it. This requires implementation of few REST APIs in the backend.
[29-June-2021]: I had a meeting with my mentors to show my current progress regarding the user data and connection with MongoDB database. The discussion in the meeting was based on deciding the data model that will be used for storing the data of user such as user's information, dashboards created by users, blocks that are present in the dashboards, etc. Additionally, the discussion included the deployment of MongoDB database in the form of Docker container.
[21-June-2021]: I had a meeting with my mentors to show my current progress regarding the functionalities of home page, canvas page along with the login functionality discussion.

[17-June-2021]: The next step is about implementing the home page and canvas page that users will have once they login. The home page consists of the list of dashboards created by the users and the canvas page is about designing the dashboard. I included the list with the help of material designs and added a button to create the dashboard.
[14-June-2021]: I started exploring the keycloak documentation as it is one of the initial steps to integrate the login functionality in the project. For implementing this, I was given few parameters by my mentors and then started exploring the documentation in a detailed manner.
[10-June-2021]: The next step is about setting up the project with multiple frameworks. This project is based on ReactJS and Flask web frameworks. ReactJS is responsible for the frontend portion and Flask is a python web framework that does the data processing in the backend. Hence, the visualizations will be implemented in ReactJS with the help of Plotly library and the SPARQL connections will be handled by the Flask backend. These days, I worked on setting up this flow and installing the required dependencies in the project.
[07-June-2021]: I started discussing about the project with my mentors and had first meeting regarding the design implementation.