Install from GitHub via
pip install git+https://github.com/dylanljones/mplstyles.git@VERSION
where VERSION is a optional release, tag or branch name.
Matplotlib allows you to customize the properties and default styles of plots. There are three ways to customize Matplotlib (see mplstyle for more information):
Warning: Setting rcParams at runtime takes precedence over style sheets, style sheets take precedence over
matplotlibrcfiles.
This project uses the third option and is intended as a collection of usefull matplotlibrc style files for scientific plotting.
Please feel free to add your own favourite styles to the libary! Start from the empty
template file default.mplstyle and change the parameters you like.
If you are happy with the style, add the file to the mplstyles package and open
a pull request.
Note: If you are using PyCharm to edit the
*.mplstylefiles, right-click on the file and click 'Override File Type'. There, choose theInifile-type. This enables some synthax highlighting, which makes it easier to find uncommented sections.
The included styles of mplstyles can be applied with the use_mplstyle method:
from mplstyles import use_mplstyle

use_mplstyle("figure")
...
The can also be used in a context:
from mplstyles import mplstyle_context

with mplstyle_context("figure"):
    ...
Alternatively, the included styles can be registered and used via the normal
plt.style method:
from mplstyles import init_mplstyles

init_mplstyles()  # register the styles

plt.style.use("figure")
...
with plt.style.context("figure"):
    ...
You can also combine styles:
from mplstyles import use_mplstyle

use_mplstyle("figure", "aps")
...
A list of all included style files can be printed like this:
from mplstyles import get_mplstyles

print(get_mplstyles())
The rc-files are contained in the .../mplstyles/styles/ directory.
The main styles are plot and figure. The plot style is intended for plotting
results while working, preparing or creating a pre-print. The figure style should be
used for generating the final figures for publications.
The journal styles are additive and should be used with the primary styles. They define the format specifications for each jornal. The style for a single column figure for the APS fournal, for example, can be used as follows:
from mplstyles import use_mplstyle

use_mplstyle("figure", "aps")
...
You also can mix in the figure size of 1.5- or double-column figures via the context manager:
from mplstyles import use_mplstyle, mplstyle_context

use_mplstyle("figure", "aps")

...  # single-coluimn plots

with mplstyle_context("aps1.5"):
    ... # 1.5-column plots

with mplstyle_context("aps2"):
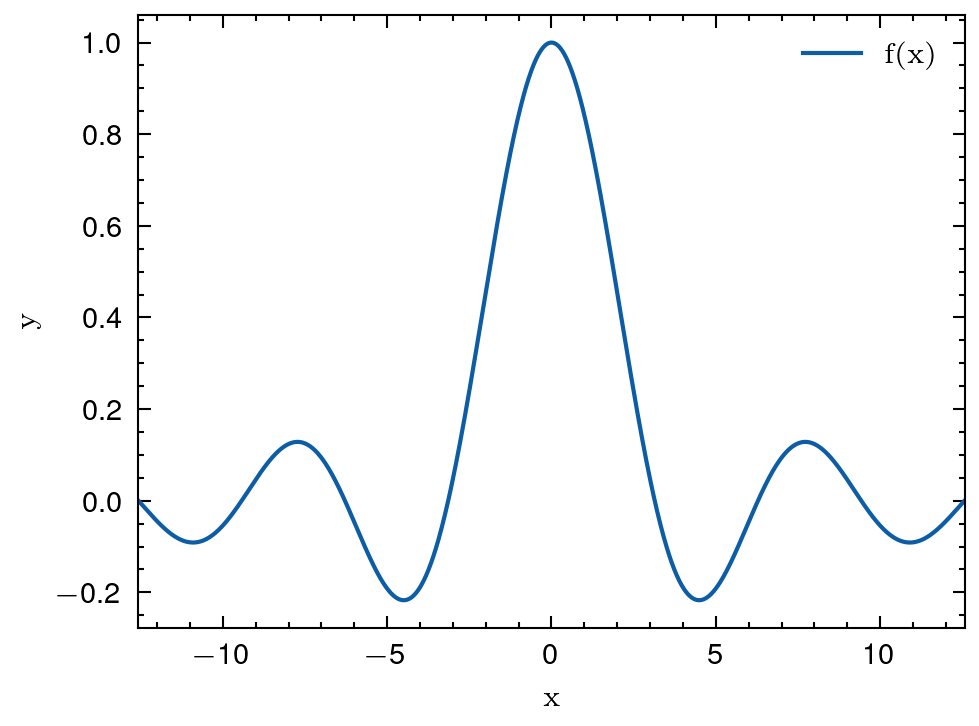
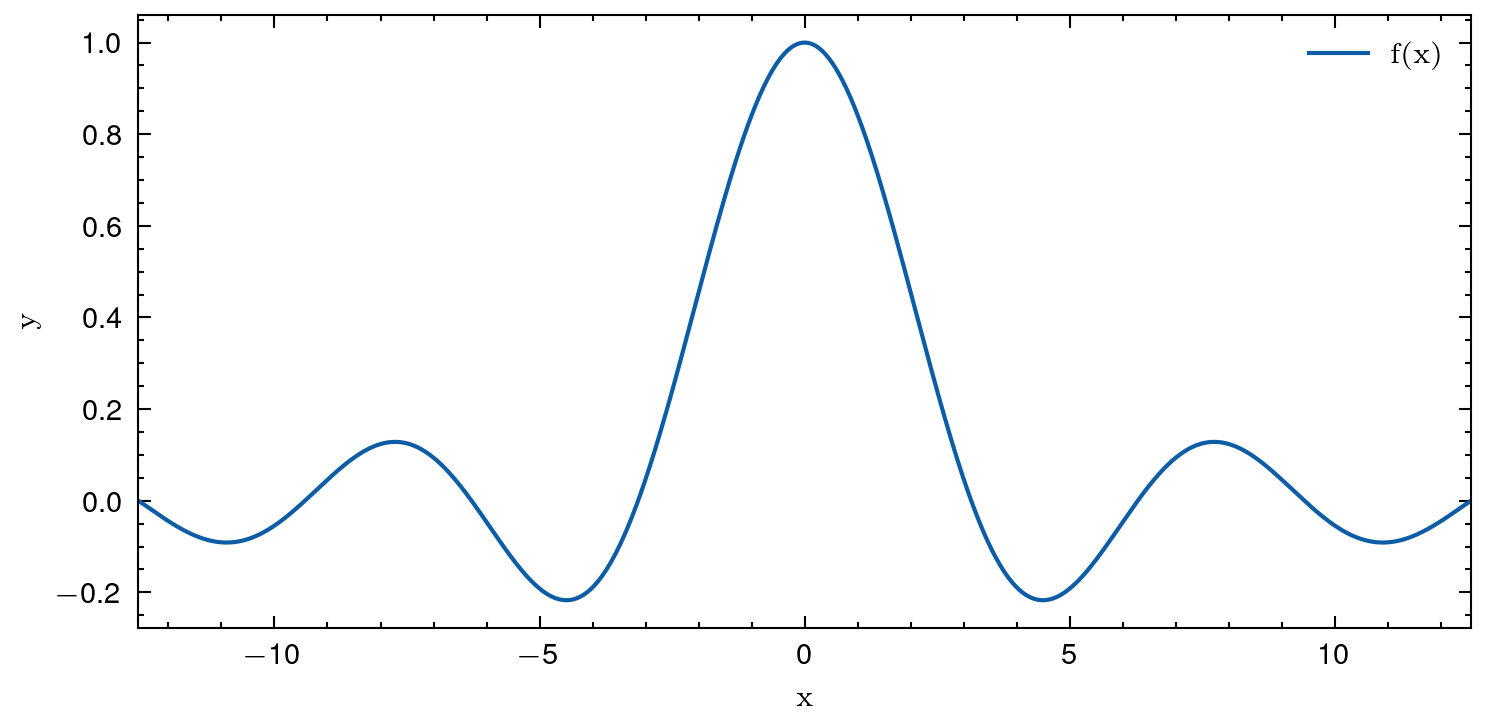
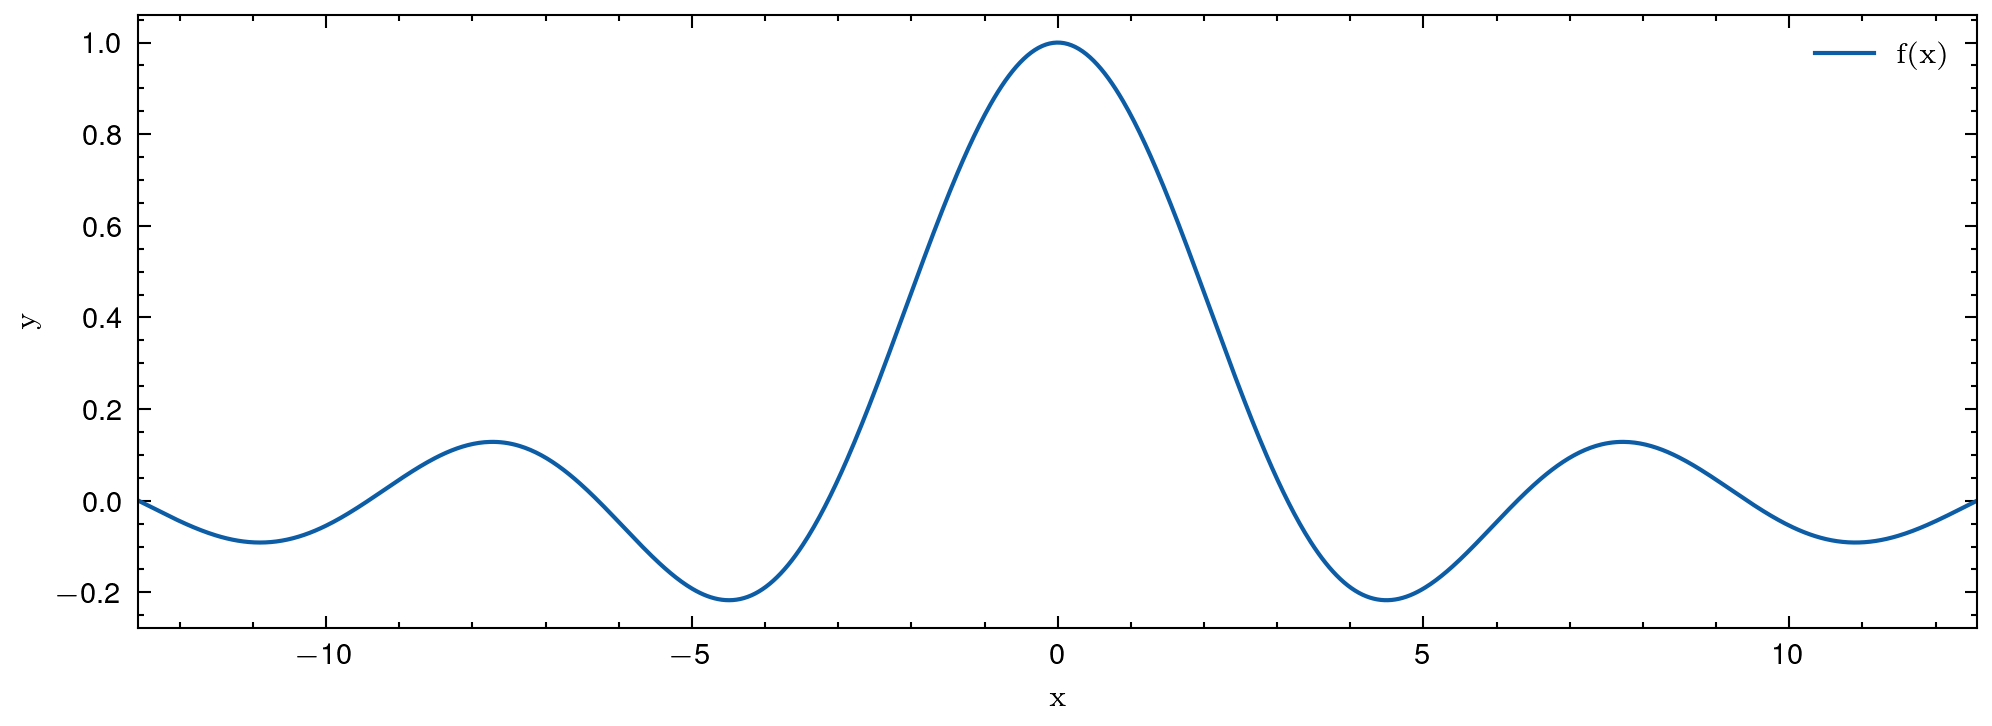
... # double-column plotsAll examples are generated with the following code and by applying the different styles:
fig, ax = plt.subplots()
ax.plot(x, y, label="f(x)")
ax.set_xlabel("x")
ax.set_ylabel("y")
ax.legend()use_mplstyle("plot")use_mplstyle("figure")Style for generatig single-column figures for APS journals (physical review, ...)
use_mplstyle("figure", "aps")Extend to 1.5- or double-column figures:
use_mplstyle("figure", "aps", "aps1.5")use_mplstyle("figure", "aps", "aps2")


