-
Notifications
You must be signed in to change notification settings - Fork 75
Dump a process
There are many tools to dump a process' memory.
MemoScope has its own module to dump process memory. If you want to dump a :
- 64 bit process, run MemoScope x64
- 32 bit process, run MemoScope x86. No problem if you run a 64 bit OS.
In the "Main" toolbar, click on "Process" button.

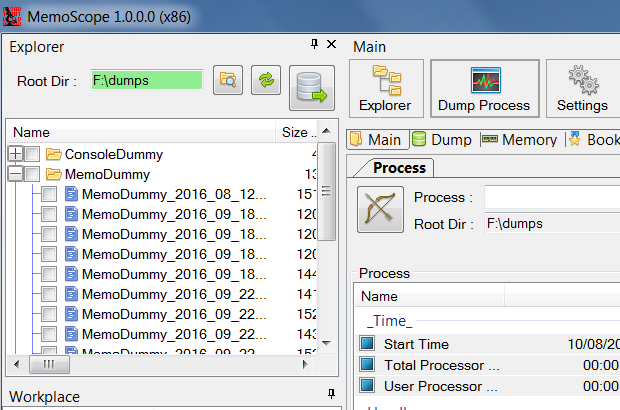
First you will have to select a "Root dir" folder where your dump files will be stored:
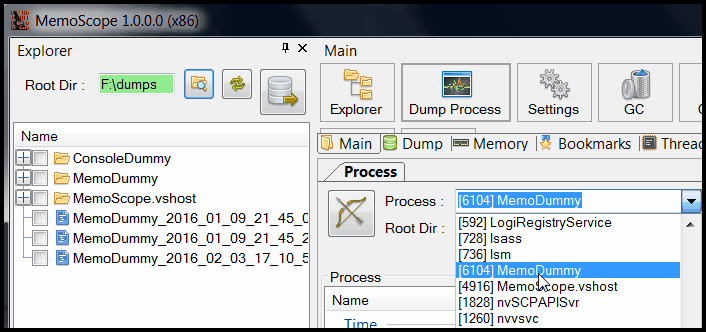
Then select a process in the combobox:
Another way to select a process :
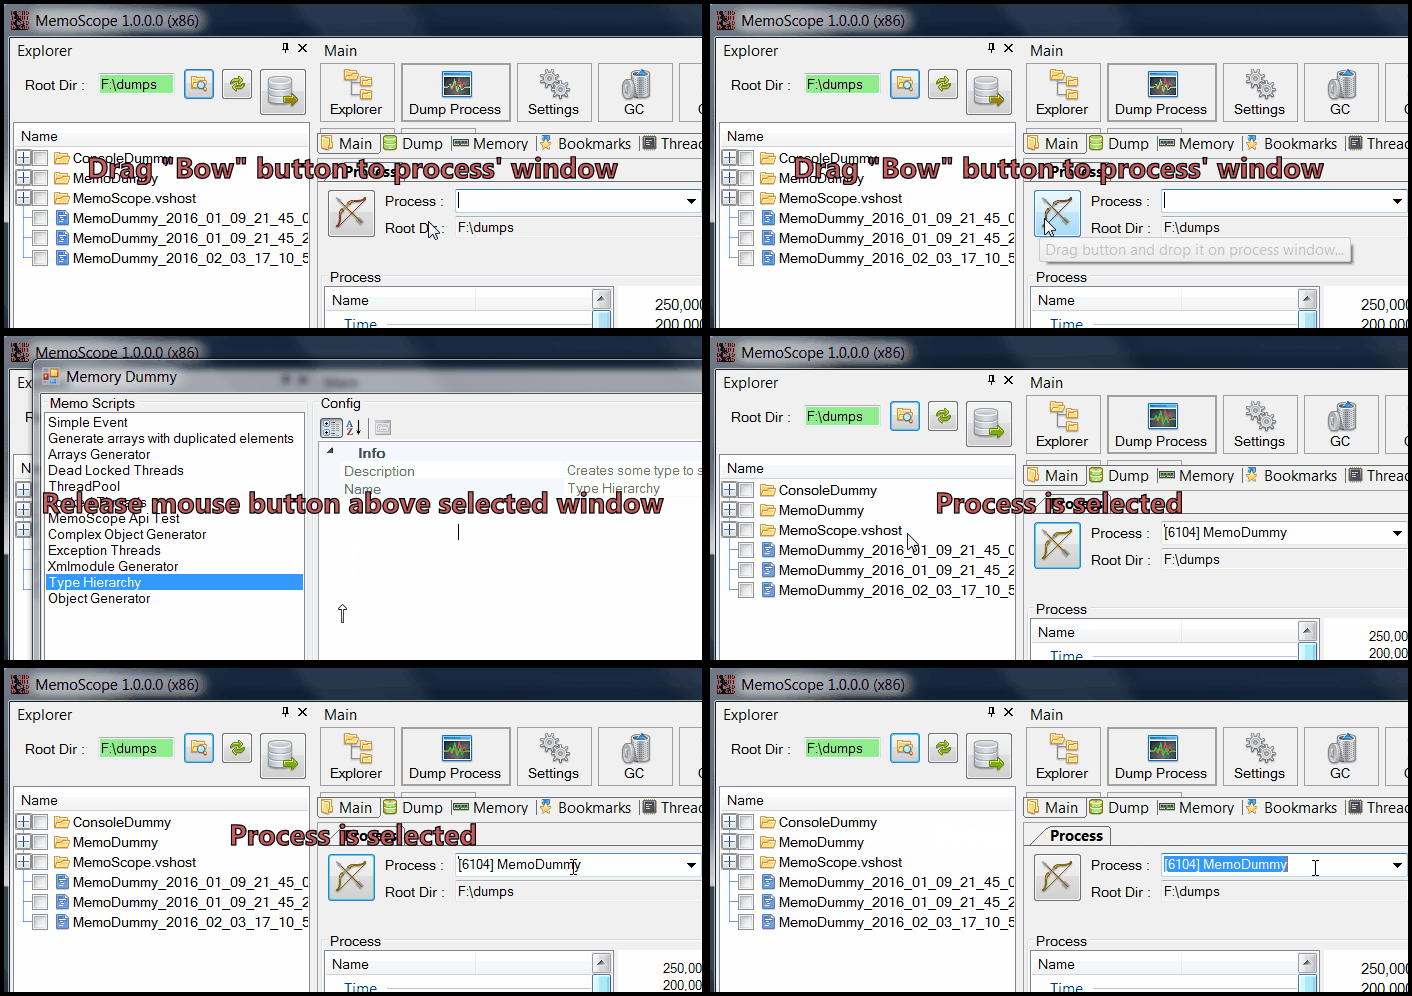
- "drag" the "Bow" button ie click on the button but don't release the button yet
- MemoScope main window is minimized
- your mouse cursor will look like an arrow
- move it over the process' window you want to dump
- release the mouse button
- MemoScope main window is back to normal state
- Your process is selected
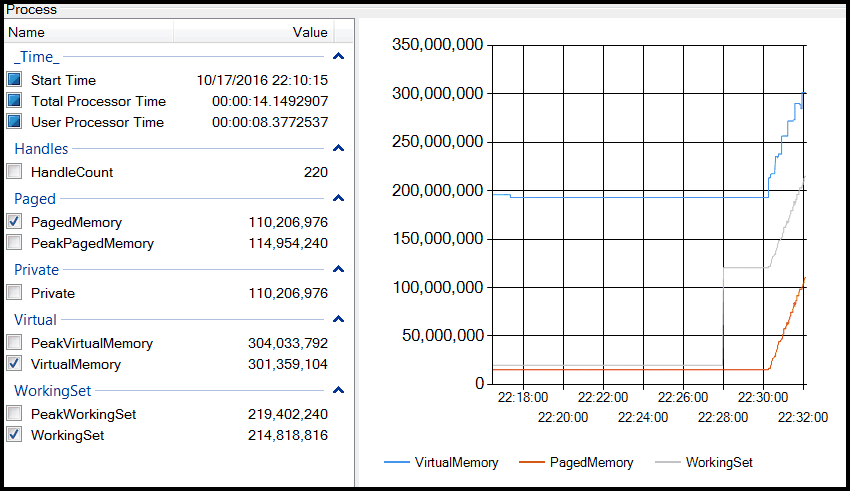
MemoScope will display and chart informations about selected process :
- Start, total process and user processor time
- Handle count
- Paged, Virtual, Working set memory


If your OS is 64 bit but your process is 32 bit, you must run the 32 bit version of TaskManager. It's located in C:\Windows\SysWOW64\taskmgr.exe
Select your process and right click on it:
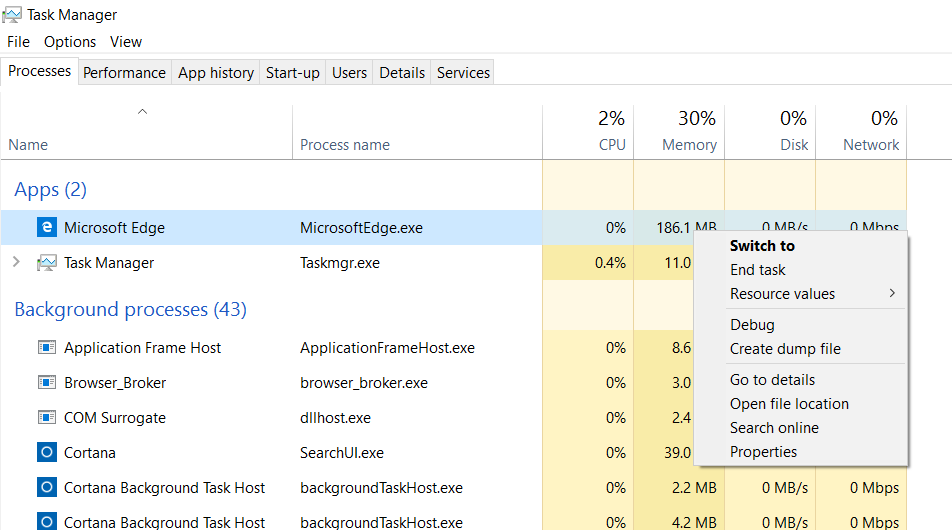
Nb: MemoScope works only on .Net processes, here Edge is selected just to take a screenshot.
Click on "Create a dump file":
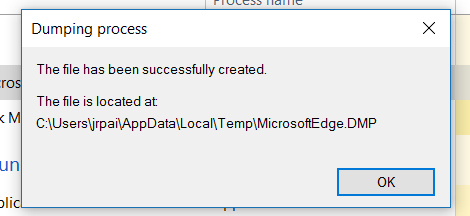
Then your dump file is created.
(thanks to @johnrp for the screenshots in english and win 10)
Sometimes, you want your process to be dumped at a specific point of your code / runtime. A good way to obtain a dump when and where you want is to call MemoScope API in your code: Request a dump in your application code:
var client = new MemoScopeClient();
client.Open();
client.DumpMe();
Start MemoScope and your application will connect to it and send a dump request.
MemoScope: Introduction - Dump a process