Skip to content
New issue

Have a question about this project? Sign up for a free GitHub account to open an issue and contact its maintainers and the community.

By clicking “Sign up for GitHub”, you agree to our terms of service and privacy statement. We’ll occasionally send you account related emails.

Already on GitHub? Sign in to your account

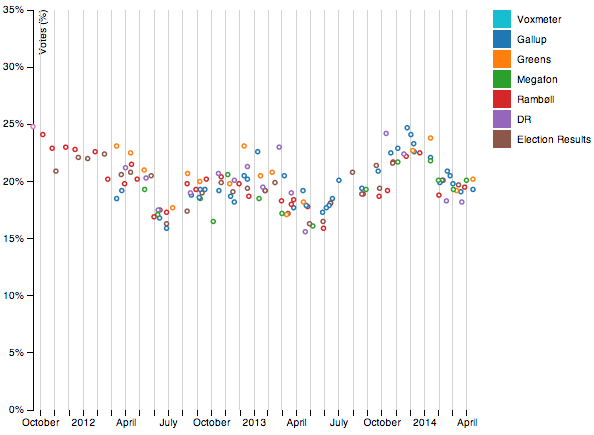
Party Trend Chart #5

Open
3 of 7 tasks
ndarville opened this issue Oct 4, 2013 · 22 comments
Open
3 of 7 tasks

Party Trend Chart #5

ndarville opened this issue Oct 4, 2013 · 22 comments

Comments

@ndarville
Copy link
Owner

Chart inspiration

Challenge

  • Implement LOESS trend line

    • For single-party display
    • For multi-party display
    • Implement on/off button for trend line vs dots
  • Refactor with d3.nest()

  • Representing data in data.csv

  • Dealing with gaps of data (ignore)
    Will involve saving the !NaN somewhere for connection:

    if !isNaN(dValue) { (previousValue !== null) ? connect() : (previousValue = dValue); }

    I should ideally write something that can be easily be included in a project.

@ndarville
Copy link
Owner Author

showAllParties = false;
if showAll === false {
    parties = ["A"];
}

@ndarville
Copy link
Owner Author

Work in Progress

How Is the Dataset Represented?

1. data.csv

Date,A,B,(...)
01/01/2012,29.02,9.27,(...)
02/01/2012,29.24,8.60,(...)
03/01/2012,29.91,8.56,(...)

2. How it is loaded

d3.csv(dataset, function(error, data) {
color.domain(
    // Make keys of all the headers in row 1
    d3.keys(data[0])
    // Don't use the "Date" header
    .filter(function(key) { return key !== dateValue; }));

// Clean data
data.forEach(function(d) {
    d.date = parseDate(d[dateValue]);
});

// Create valueColumns array
//// valueColumns = {
////     name: name,
////     values: {
////         [
////             date: d.date,
////             dataValue: parseFloat(d[name])
////         ],  [ ... ]
////     }
//// }
var valueColumns = color.domain()
    .map(function(name) {
        return {
            name: name,
            values: data.map(function(d) {
                return {
                    date: d.date,
                    dataValue: parseFloat(d[name])
                };
            })
        };
    });
Object =>
    name: "O"
    values: Array[14] =>
         0: Object
         1: Object
         2: Object
         3: Object
         4: Object
         5: Object
         6: Object
         7: Object
         8: Object
         9: Object
        10: Object
        11: Object
        12: Object
        13: Object

x 9 for some reason --- same as the number of parties.

Fixed by appending to svg instead of graph.

3. How it is rendered

// For all the names in valueColumns
graph.selectAll(".dot")
    .data(valueColumns.filter(function(d) {
        return d.name !== "";
    }))
    .enter().append("circle")
        .attr({
            "class": "dot",
            "r": 2,
            "cx": function(d, i) {
                return x(d.values[i].date);
            },
            "cy": function(d, i) {
                return y(d.values[i].dataValue);
            },
            "stroke": function(d) {
                return color(d.name);
            }});

This only iterates over the array of names; it does not iterate over each name in the list afterwards.

@ndarville
Copy link
Owner Author

To do

  • Re-implement code with d3.nest()
  • Create trendlines with science.js

General

  • Refactor ignore filter programmatically
  • Party labels
  • Linear trend line
    • Lacks confidence interval and support for multiple parties at the moment
  • Different minima and maxima for solo view

Institutes

  • Institute labels
  • Institute-based colouring for solo display
  • Confidence interval for institutes
    • Maybe this will work better, once d3.nest() is implemented
    • Show only one institute area on legend highlight and grey out other dots

@ndarville
Copy link
Owner Author

color.domain(
    d3.keys(data[0])
    .filter(function(key) {
        return key !== dateValue && key !== "Lead" && key !== "Red (A+B+F+Ø)" && key !== "Blue (V+O+I+C+K)" && key !== "Polling Firm";
}));
instituteColor.domain(["Voxmeter", "Gallup", "Greens", "Megafon", "Rambøll", "DR"])

@ndarville
Copy link
Owner Author

Ignore filter implemented:

color.domain(
    d3.keys(data[0])
    .filter(function(key) {
        if (ignoreFilter.indexOf(key) === -1) return key;
    }));

Not sure why it had to have === and not !==. Maybe I’m just tired.

@ndarville
Copy link
Owner Author

Two working solutions to the polling firms, via seemant on IRC:

instituteColor.domain(
    d3.nest().key(function(d) {
        return d["Polling Firm"];
    })
    .map(data, d3.map)
    .keys()
);
instituteColor.domain(
    d3.nest().key(function(d) {
        return d["Polling Firm"];
    })
    .entries(data)
    .map(function(d) { return d.key; })
);
[20:12:57]  <seemant>    http://is.gd/TulFbm <-- you wanna bookmark this
[20:13:05]  <seemant>    (well, you wanna read it quick first)
[20:13:32]  <seemant>    there's stuff in your code that can take advantage of that tutorial
[20:13:56]  <seemant>    (basically any time you're reading csv or tsv, it's likely you'll need to do those kinds of things htat are onthe page)

@ndarville
Copy link
Owner Author

  • Fix mis-match in the colour of the dots and the legend:

Colour mis-match

@ndarville
Copy link
Owner Author

Confidence Interval

data

Object =>
    name: "O"
    values: Array[143] =>
        0: Object
            date: ...,
            dataValue: ...,
            institute: ...,
            confidence: ...

d.values

    values: Array[143] =>
        0: Object
            date: ...,
            dataValue: ...,
            institute: ...,
            confidence: ...

@ndarville
Copy link
Owner Author

@ndarville
Copy link
Owner Author

  • Double check and export as JSON to here the returned data; looks like a lot of redundancy there.

@ndarville
Copy link
Owner Author

Linear-regression code:

@ndarville
Copy link
Owner Author

  • Legend bugs out, if you provide 1 < x < parties.length parties in `var parties´.

screen shot 2014-05-31 at 13 39 36

Solution: perform legend checks for showAllParties === true and parties.length > 1.

@ndarville
Copy link
Owner Author

Actually, it fails on single for showAllCharts = true.

@ndarville
Copy link
Owner Author

Fixed the bug; was missing a (d) on color.

ndarville added a commit that referenced this issue May 31, 2014
@ndarville
Copy link
Owner Author

Reference to related issue on science.js: jasondavies/science.js#12.

@ndarville
Copy link
Owner Author

Thanks to @radiodario for sorting it out:

[12:55:16]  <pessimism>     radiodar1o: In case you just happen to be a science.js pro, let me know if you can figure out how to plot a LOESS trend in this: http://bl.ocks.org/ndarville/1875db6aebe05f0037bf
[12:55:27]  <pessimism>     spent ages trying to figure it out, but to no avail
[12:56:14]  <radiodar1o>    hmm i'm no science.js pro - is it like a linear regression?
[12:57:35]  <pessimism>     yep
[12:58:35]  <pessimism>     it's been a while, but I think it takes two arrays of x and y coordinates as an argument and spits out the trend (LOESS) line, but it goofs, whenever I give it a shot
[12:59:05]  <pessimism>     here's an example: http://bl.ocks.org/ckuijjer/6840308
[13:02:56]  <radiodar1o>    oh so it's like an average trend curve
[13:03:53]  <radiodar1o>    var loessData = loess([xVal], [yVal])[0];
[13:04:08]  <radiodar1o>    shouldn't that be var loessData = loess(xVal, yVal)[0];
[13:04:15]  <pessimism>     I haven't the faintest
[13:04:21]  <radiodar1o>    i think xval and yval are arrays
[13:04:28]  <pessimism>     cloning it, sec
[13:04:39]  <radiodar1o>    yeah i think you're passing arrays of arrays
[13:04:43]  <radiodar1o>    where you should just be passing arrays
[13:04:59]  <radiodar1o>    on ckuijjer's example he passes arrays: var xValues = data.map(xMap); var yValues = data.map(yMap); var yValuesSmoothed = loess(xValues, yValues);
[13:05:12]  <radiodar1o>    so that might be your problem?
[13:05:52]  <pessimism>     giving it a show
[13:06:50]  <pessimism>     *shot
[13:06:58]  <pessimism>     hmm, getting a bunch of errors
[13:07:09]  <radiodar1o>    you might also want to parse the date
[13:09:21]  <radiodar1o>                        var xVal = data.map(function(d) { return x(d.date); });
[13:09:22]  <radiodar1o>                        var yVal = data.map(function(d) { return d.A;    });
[13:09:22]  <radiodar1o>                        var loessData = loess(xVal, yVal)[0];
[13:09:26]  <radiodar1o>    (sorry for the spam)
[13:09:29]  <pessimism>     np
[13:09:50]  <radiodar1o>    i hate bl.ocks.org's cache times
[13:09:54]  <radiodar1o>    hard to see what changes you make
[13:10:28]  <pessimism>     not making any changes - just doing it locally for now
[13:11:28]  <pessimism>     it's been so long since I last used it, can barely make heads or take of it
[13:11:35]  <pessimism>     but nothing seems to stop errors popping up
[13:11:45]  <pessimism>     I think the date-parsing is already taken care of in data.forEach?
[13:11:56]  <radiodar1o>    nope
[13:12:06]  <radiodar1o>    also your yVal is full of strings
[13:12:09]  <radiodar1o>    not numbers
[13:14:58]  <pessimism>     xVal is fine; yVal needed a parseFloat
[13:16:13]  <radiodar1o>    loessdata is returning nans
[13:16:21]  <pessimism>     yep
[13:16:23]  <radiodar1o>    loess(xVal, yVal) is returning nans
[13:16:26]  <radiodar1o>    so xVal is not fine
[13:16:27]  <radiodar1o>    :)
[13:16:53]  <pessimism>     returns an array of NaNs without [0], which seems to be an improvement :P
[13:17:11]  <pessimism>     but the parsing of xVal must be f'd
[13:17:33]  <pessimism>     var loessData = loess(parseDate(xVal), yVal) returns an error
[13:17:53]  <pessimism>     can't imagine a LOESS function can't take date arguments, so something must be amiss
[13:18:43]  <pessimism>     pushing the most recent version now
[13:19:10]  <pessimism>     logs xVal, yVal and loessData in console
[13:19:48]  <radiodar1o>    well if you look at ckuijjer's example, he transforms the values
[13:20:01]  <radiodar1o>    var xValues = data.map(xMap);
[13:20:29]  <radiodar1o>    the xMap function is doing xMap = function(d) { return xScale(xValue(d)); },
[13:21:53]  <radiodar1o>    have you tried debugging your call to loess?
[13:22:30]  <pessimism>     not the call itself, no; just var loessData = loess(xVal, yVal); and console.log(loessData);
[13:22:48]  <pessimism>     how would you go about that?
[13:25:57]  <radiodar1o>    do you know how the chrome developer tools work?
[13:26:01]  <radiodar1o>    and debugger;
[13:26:21]  <radiodar1o>    you can put debugger; anywhere in your code and if you have the dev tools open on chrome it'll pause execution and let you step over etc
[13:26:27]  <pessimism>     ah
[13:26:37]  <radiodar1o>    https://developer.chrome.com/devtools/docs/javascript-debugging
[13:26:38]  <pessimism>     only use console logging
[13:26:44]  <radiodar1o>    uh man reallly?
[13:26:49]  <radiodar1o>    this is gonna blow your mind :)
[13:27:37]  <radiodario>    anyway you're almost there - somehow the call to loess is returning NaNs so something is amiss
[13:30:01]  <radiodario>    uh i know why
[13:30:07]  <radiodario>    xVal is returning values sorted desc
[13:30:22]  <radiodario>    i think it might need values to be sorted ascendent?
[13:30:37]  <pessimism>     we'll give it a shot
[13:32:38]  <pessimism>     no dice with var xVal = data.map(function(d) { return d.date;          }).sort();
[13:33:41]  <pessimism>     d'oh, forgot to sort yVal accordingly
[13:33:52]  <radiodario>    got it!
[13:34:08]  <pessimism>     ?
[13:35:01]  <radiodario>    http://bl.ocks.org/radiodario/226b6c6b8ff9c6398c59
[13:35:18]  <pessimism>     !!
[13:35:19]  <radiodario>    yeah you had to reverse the arrays, and obviously parse the dates and the strings into their representational value
[13:35:39]  <radiodario>    look at where it says // connect the dots with a line
[13:35:43]  <radiodario>    that's where i made my changes
[13:35:55]  <radiodario>    you owe me a pint mate :)
[13:36:00]  <pessimism>     ohyeah
[13:36:06]  <pessimism>     thanks a bunch
[13:36:21]  <pessimism>     trouble in javascript drives me crazy
[13:37:45]  <radiodario>    read that link i sent you about debugging
[13:37:56]  <radiodario>    it's gonna up your JS game 1000x
[13:38:03]  <pessimism>     yup
[13:38:15]  <pessimism>     does it also work, if you parse yVal as parseFloat instead of an integer?
[13:38:34]  <radiodario>    there's only Number in javascript
[13:38:39]  <radiodario>    there's no Int or Float
[13:38:44]  <pessimism>     oh
[13:38:45]  <radiodario>    so it's either a number or it isnt
[13:39:06]  <radiodario>    so using + is just a shorthand to coerce the variable value to a number
[13:39:26]  <radiodario>    but yeah the "clean" way would be to do parseFloat
[13:39:57]  <pessimism>     as long as it gets the job done
[13:40:00]  <pessimism>     all about shorthand
[13:40:08]  <radiodario>    it's really confusing because you have these functions like parseInt and parseFloat that hint at returning an int or a float, but they both return a Number

@ndarville
Copy link
Owner Author

Still need to change the code to work for > 1 parties.

Some of the errors:

  • Wrapped array arguments in brackets for no reason
  • Followed it up by using [0] on them
  • yVal was an array of strings, not numbers
  • The values were sorted in descending order—not ascending (hence .reverse())

@radiodario
Copy link

Hey thanks for the kudos 👍

I think the most important thing to stress here is that values to loess have to be passed in ascending order.

@ndarville
Copy link
Owner Author

New error emerges, when more data is used: http://bl.ocks.org/ndarville/1875db6aebe05f0037bf.

Happens from object [194] and onward, all of which are NaN.

@ndarville
Copy link
Owner Author

Fixed the error; it had an errant 2014 instead of 2015 at the very top. (@radiodario.)

  • Catch this by sorting the array in the future.

Especially when missed data is appended at the bottom—non-chronologically.

@ndarville
Copy link
Owner Author

diff --git a/index.html b/index.html
index 8922fb0..68a35db 100644
--- a/index.html
+++ b/index.html
@@ -59,6 +59,7 @@
     <body>
         <!-- <script src="http://d3js.org/d3.v3.min.js"></script> -->
         <script src="d3.min.js?v=3.2.8"></script>
+        <script src="science.v1.min.js?v=1.9.1"></script>
         <script type="text/javascript"charset="utf-8">
             // Settings
             var width = 440,
@@ -82,15 +83,15 @@
                 electionDate = "", // "09/14/2015", // Breaks when the year is 2015 for some reason
                 yAxisTitle = "Votes (%)",
                 dateValue = "Date",
-                instituteValue = "Polling Firm"
-                showLineChart = false,
+                instituteValue = "Polling Firm",
                 showDots = true,
                 showAllParties = false,
                 recalculateYMax = false;
-                if (showAllParties === false) {
-                    var parties = ["A"];
-                }
-                var displayInstitutes = (showAllParties === false && parties.length === 1) ? true : false;
+                parties = showAllParties === true ? [] : ["A"];
+
+            // Autoconfig
+            var singleParty = (showAllParties === false && parties.length === 1) ? true : false,
+                displayInstitutes = singleParty;

             var ignoreFilter = [
                 "Lead",
@@ -120,12 +121,6 @@
                 .orient("left")
                 .tickFormat(function(d) { return d + "%"; });

-            var line = d3.svg.line()
-                .interpolate("linear")
-                .defined(function(d) { return !isNaN(d.dataValue); })
-                .x(function(d) { return x(d.date); })
-                .y(function(d) { return y(d.dataValue); });
-
             var svg = d3.select("body").append("svg")
                 .attr({
                     "width": width + margin.left + margin.right,
@@ -171,7 +166,7 @@
                                 values: data.map(function(d) {
                                     return {
                                         date: d.date,
-                                        dataValue: parseFloat(d[name]),
+                                        dataValue: +d[name],
                                         institute: d[instituteValue]
                                     };
                                 })
@@ -185,7 +180,7 @@
                 ]);

                 // Compute y.domain()
-                if (recalculateYMax === true && showAllParties === false && parties.length === 1) {
+                if (recalculateYMax === true && singleParty === true) {
                     y.domain([
                         0, d3.max(data, function(d) { return d[parties[0]]; })
                     ]);
@@ -251,16 +246,28 @@
                         });
                 }

-                // Connect the dots with line
-                /// No support for null values
-                if (showLineChart === true) {
+                // Plot LOESS regression
+                if (singleParty === true) {
+                    var line = d3.svg.line()
+                        .interpolate("linear")
+                        .x(function(d) { return d[0]; })
+                        .y(function(d) { return d[1]; });
+
                     graph.append("path")
-                        .attr({
-                            "class": "line",
-                            "d": function(d) { return line(d.values); }
+                        .datum(function() {
+                            var loess = science.stats.loess();
+                            loess.bandwidth(.2);
+
+                            var xVal = data.map(function(d) { return x(d.date); }).reverse(),
+                                yVal = data.map(function(d) { return y(+d[parties[0]]); }).reverse(),
+                                loessData = loess(xVal, yVal);
+
+                            return d3.zip(xVal, loessData);
                         })
+                        .attr("class", "line")
+                        .attr("d", line)
                         .style("stroke", function(d) {
-                            return (showAllParties === false && parties.length === 1) ? "#777" : color(d.name);
+                            return singleParty === true ? "#777" : color(d.name);
                         });
                 }

@ndarville
Copy link
Owner Author

d3.nest()

Sign up for free to join this conversation on GitHub. Already have an account? Sign in to comment
Projects
None yet
Development

No branches or pull requests

2 participants