You can start Prometheus and Grafana Containers with this docker-compose.yml.
version: '3'
services:
  prometheus:
    image: prom/prometheus:v2.3.2
    container_name: prometheus
    volumes:
      - ./prometheus.yml:/etc/prometheus/prometheus.yml
    ports:
      - 9090:9090
  grafana:
    image: grafana/grafana:5.2.2
    container_name: grafana
    ports:
      - 3000:3000
    env_file:
- ./grafana.envscrape_configs:
- job_name: 'prometheus'
static_configs:
- targets:
- 'localhost:9090'
- job_name: 'spring'
metrics_path: '/prometheus'
static_configs:
- targets:
- 'docker.for.mac.host.internal:8080'You should change docker.for.mac.host.internal to the host address.
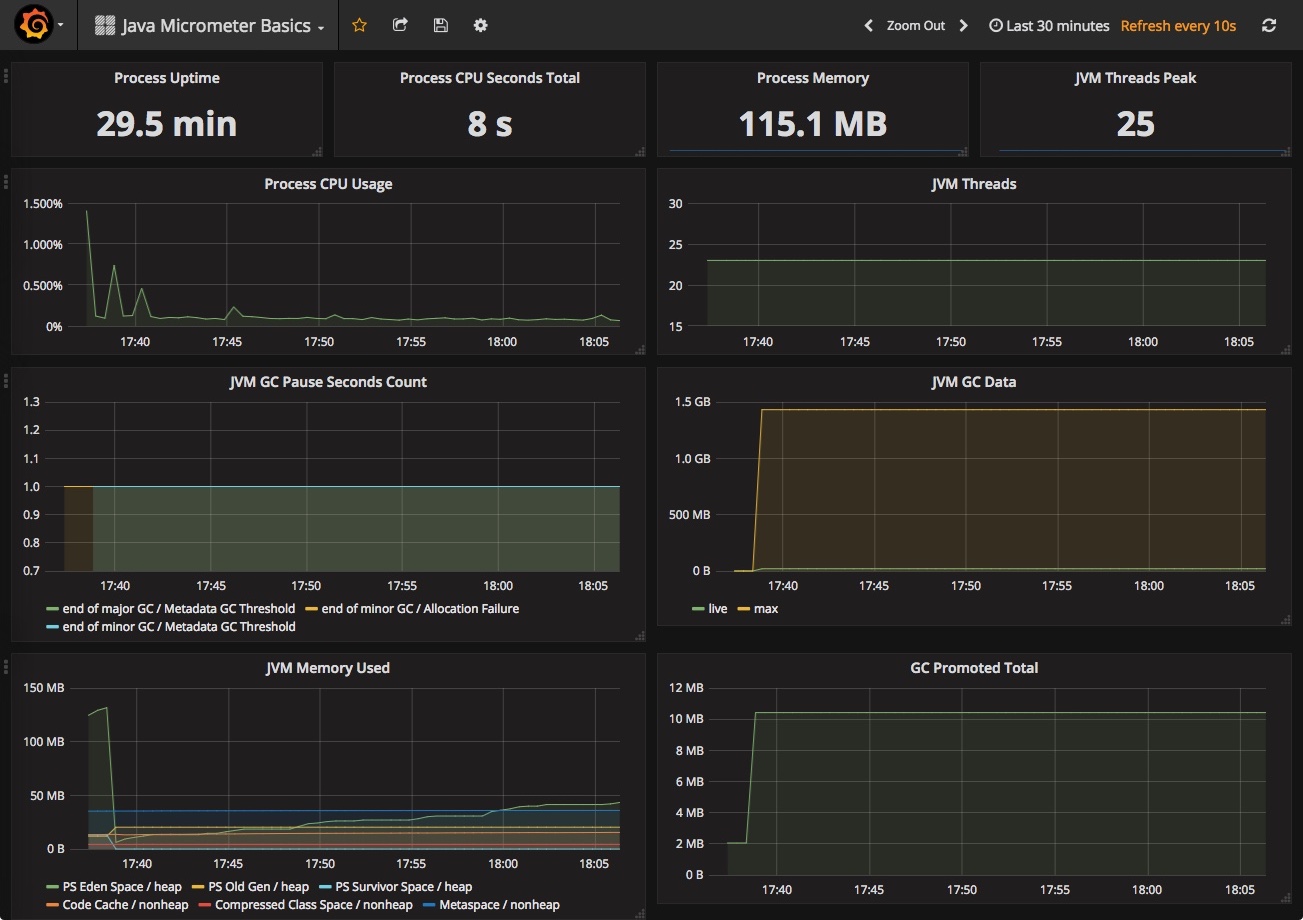
Import Java Micrometer Basics.json to your Grafana Server or find this Dashboard(ID: 4683) on Grafana.com.
dependencies {
    ...
    compile 'org.springframework.boot:spring-boot-starter-actuator'
    compile 'io.micrometer:micrometer-spring-legacy:1.0.6'
    compile 'io.micrometer:micrometer-registry-prometheus:1.0.6'  // You should add this line for prometheus.
    ...
You can start a sample project of Spring Boot (Ver.1.5.15) with this proto folder outside of containers.