Replies: 3 comments
-
|
I think you're missing the |
Beta Was this translation helpful? Give feedback.
-
|
ok so that got me almost exactly where I need to be. Thank you! I'd just like to get rid of the connecting line for average distance. If it's not possible that's fine. This is already much better |
Beta Was this translation helpful? Give feedback.
-
|
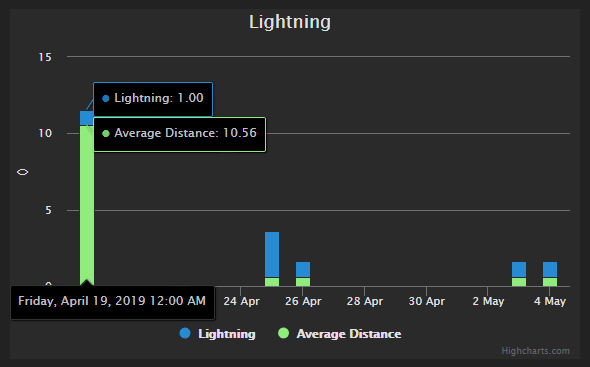
ok so I think I'm getting pretty close here. I have the stacking the way I want it and I have closest strike instead of average, just my preference. Where I'm having trouble is I have total strikes showing up on days when there wasn't any lightning. In this screenshot there is only one day where there was lightning. that's the only day I want a stat to show up. The other problem I have that I can't figure out how to correct is the way time is displayed. If you look in this screenshot you'll see that for Rain I have a date with a month and a noon marker. I'm not sure why that is how all my other graphs show but I like it better than the way the Lightning is shown. I'm not actually sure what the lightning is showing. it looks like the 3rd but the rain took place on the 4th. I'm confused by this. Here's what I have for both name = Rain Total |
Beta Was this translation helpful? Give feedback.


-
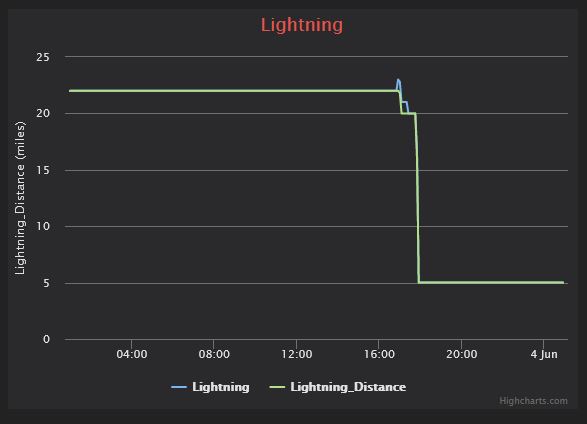
I used the Charts Document to create my lightning graph and i want it to be stacked columns the way it is displayed in that document but I am not getting that.
Here is my configuration:
what I have:
what I want: :
Beta Was this translation helpful? Give feedback.
All reactions