-
Notifications
You must be signed in to change notification settings - Fork 5
/
Copy pathexample.qmd
91 lines (71 loc) · 2.06 KB
/
example.qmd
1
2
3
4
5
6
7
8
9
10
11
12
13
14
15
16
17
18
19
20
21
22
23
24
25
26
27
28
29
30
31
32
33
34
35
36
37
38
39
40
41
42
43
44
45
46
47
48
49
50
51
52
53
54
55
56
57
58
59
60
61
62
63
64
65
66
67
68
69
70
71
72
73
74
75
76
77
78
79
80
81
82
83
84
85
86
87
88
89
90
91
---
title: "Example Presentation"
subtitle: "Create beautiful interactive slide decks with Reveal.js"
format:
revealjs:
slide-number: true
chalkboard:
buttons: false
preview-links: auto
pointer:
pointerSize: 18
color: '#32cd32'
revealjs-plugins:
- pointer
---
## Hello, There
This presentation has a handful of slides which can be used to demonstrate the `pointer` extension.
Press 'q' to enter and exit the pointer mode.
## Pretty Code {auto-animate="true"}
- Over 20 syntax highlighting themes available
- Default theme optimized for accessibility
``` r
# Define a server for the Shiny app
function(input, output) {
# Fill in the spot we created for a plot
output$phonePlot <- renderPlot({
# Render a barplot
})
}
```
::: footer
Learn more: [Syntax Highlighting](https://quarto.org/docs/output-formats/html-code.html#highlighting)
:::
## Code Animations {auto-animate="true"}
- Over 20 syntax highlighting themes available
- Default theme optimized for accessibility
``` r
# Define a server for the Shiny app
function(input, output) {
# Fill in the spot we created for a plot
output$phonePlot <- renderPlot({
# Render a barplot
barplot(WorldPhones[,input$region]*1000,
main=input$region,
ylab="Number of Telephones",
xlab="Year")
})
}
```
::: footer
Learn more: [Code Animations](https://quarto.org/docs/presentations/revealjs/advanced.html#code-animations)
:::
## Line Highlighting
- Highlight specific lines for emphasis
- Incrementally highlight additional lines
``` {.python code-line-numbers="4-5|7|10"}
import numpy as np
import matplotlib.pyplot as plt
r = np.arange(0, 2, 0.01)
theta = 2 * np.pi * r
fig, ax = plt.subplots(subplot_kw={'projection': 'polar'})
ax.plot(theta, r)
ax.set_rticks([0.5, 1, 1.5, 2])
ax.grid(True)
plt.show()
```
::: footer
Learn more: [Line Highlighting](https://quarto.org/docs/presentations/revealjs/#line-highlighting)
:::
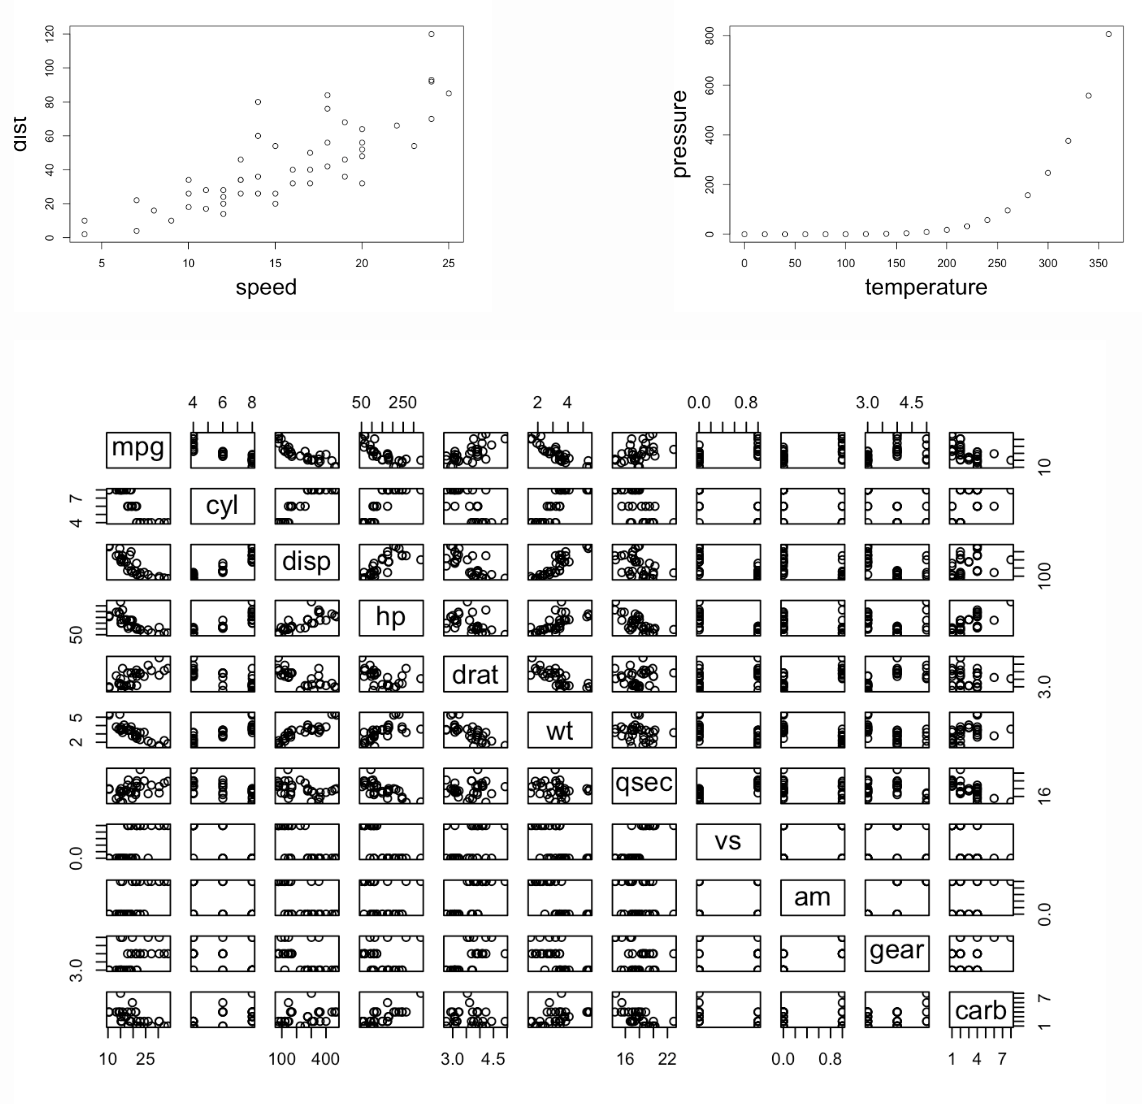
## Pointer on top of figure
