I have since moved on using HOome Assistant for solar energy monitioring. Since developing multisma HA has added support for multiple innverters and is fully intigrated with the home energy use, making it a superior solution for my home energy montioring.
- Overview
- What's new
- Rationale for multisma2
- Requirements
- Installation
- Docker setup
- Sunny Boy History Utility
- Operation
- InfluxDB2 Schemas
- Pruning database entries
- Sample Dashboards
- Errors
- Thanks
Improved Python application for real-time monitoring one or more SMA Sunny Boy inverters.
Now features a wider range of outputs, basically anything you see in your browser when connected to an SMA inverter with WebConnect can be pulled and sent to your InfluxDB database or as an MQTT message (or both).
- current AC production (site and inverter breakdowns)
- current DC production (site, inverter, and string breakdowns)
- total production (day, month, year, and lifetime)
- inverter efficiency
- inverter status
- CO2 avoided due to PV production
- sun elevation and azimuth
- estimate of solar irradiation on a tilted surface at your location
- MQTT messaging
- InfluxDB interface (writes production data and status direct to InfluxDB 1.8.x and 2.x)
- utility available to extract historical inverter production data to InfluxDB (sbhistory)
- Various minor bug fixes
- Warning messages issued if either MQTT or InfluxDB are disabled in the YAML configuration file
- Updated code with improvements made in cs_esphome
- added database pruning by YAML file tasks in the InfluxDB options
- Bug fixes.
- added day/month/year kWh totals to the InfluxDB2 output to simplify queries. These are located at midnight each day for daily production. midnight on the first of the month for the monthly total, and at midnight on January 1st for the annual total. These data points are current so reflect year-to-date,month-to-date, and day-to-date results.
multisma2 is driven by my desire to see what is happening in my ground mount solar array which uses three Sunny Boy inverters tied to eight strings of nine panels each (total 24.84 kWp). SMA offers Sunny Portal which is a non-real time window of the AC production and this quickly proved to be inadequate. It also uses an unknown and less than robust averaging algorithm which guarantees that I never see my peak production where there is the chance of the inverter limiting the output. There is more data available using the WebConnect interface but you need to log into each inverter to get it, with three inverters to check, multisma2 fixes this by working with one or many Sunny Boy inverters and combines the data intelligently for easy display or analysis.
I wanted a real-time dashboard in Home Assistant that displays both the site totals and the individual inverters so multisma2 is the result, building on the pysma project to log into each inverter and pull ALL the data in the Instantaneous values menu every fast event loop from each inverter. This is cached and you display selected outputs at various intervals depending on your needs. For example, I report the AC production, DC production (by inverter and string), and inverter status in the fast loop. Slower changing outputs such as total production and sun elevation/azimuth occurs every 30 or 60 seconds.
multisma2 is now complete for my purposes but there could be small improvements and the inevitable bug fixes. Of course comments and feedback are welcome or you have a question on Sunny Boy inverters (at least the ones I have access to) feel free to ask.
-
Python 3.8 or later (currently using 3.9.5 from an Ubuntu Hirsute Docker container)
-
Python packages used include (but the list in the
setup.pyfile is the definitive list of packages)- paho-mqtt
- aiohttp
- asyncio
- astral
- pysolar
- python-dateutil
- jmespath
- influxdb-client
- python-configuration
- pyyaml
-
SMA Sunny Boy inverter(s) supporting WebConnect
-
Docker (a Dockerfile is supplied to allow running in a Docker container, I run this on a Raspberry Pi4 with 8GB memory that also has containers running instances of Portainer, InfluxDB2, Telegraf, Grafana, and other useful applications)
- Clone the multisma2 repository and install the Python packages:
    git clone https://github.com/sillygoose/multisma2
    cd multisma2
    pip3 install -e .
-
Rename the
example.secrets.yamlfile tomultisma2_secrets.yaml, if you plan on using secrets. Themultisma2_secrets.yamlfile is tagged in the.gitignorefile and will not be included in the repository but if you wish you can putsecrets.yamlin any parent directory as multisma2 will start in the current directory and look in each parent directory up to your home directory for it (or just the current directory if you are not running in a user profile).Edit
multisma2.yamlandsecrets.yamlto match your site, you will need the IP addresses for each inverter and the login credentials. If you are using MQTT then you need the IP address of your MQTT broker and the login credentials, if interfacing to InfluxDB you need the host addressm site name, bucket, and login credentials.
There are some other fields to configure for the log files, time zone, site location, etc, these should be easy to figure out.
-
Test that multisma2 connects to your inverters, MQTT broker, and InfluxDB database:
python3 multisma2/multisma2.py
Once you have a working multisma2.yaml file you can build a Docker container that runs multisma2:
    sudo docker build --no-cache -t multisma2:your-tag .
    sudo docker image tag multisma2:your-tag multisma2:latest
    sudo docker-compose up -d
where your-tag is a string of your choosing (the --no-cache option will force Docker to pull the latest version of multisma2 from GitHub). The docker-compose.yaml file assumes the image to be multisma2:latest, the second command adds this tag so you can use the docker-compose file to start the new instance and keep the old image as a backup until the new version checks out.
As an example, suppose you download the current multisma2 build of 1.1.0. Then to create and run the Docker container you would use
    sudo docker build --no-cache -t multisma2:1.2.2 .
    sudo docker image tag multisma2:1.2.2 multisma2:latest
    sudo docker-compose up -d
There is a useful utility that complements multisma2 in the sbhistory repo:
git clone https://github.com/sillygoose/sbhistory
If you are just starting out with multisma2, you are collecting data but you have no past data to work with. sbhistory fixes this by allowing you to download the past history from your SMA inverter(s) and import it into your InfluxDB database.
sbhistory will use the settings in your multisma2 YAML file, you can just append it to the sample sbhistory YAML file, pick the few sbhistory options and transfer the history in one pass. Now your dashboards can display the past 30 day and yearly solar production from your SMA inverter(s) and look really good.
    sbhistory:
      daily_history:
      enable: True
      start: '2021-09-01'

    fine_history:
      enable: True
      start:  '2021-09-01'

    multisma2:
        ...
multisma2 runs during daylight hours, which is dawn to dusk. Once dusk occurs, the active inverter sampling ceases until dawn on the following day. A night time loop is then turned on to provide MQTT and database updates using the last inverter values (which are all zero).
| Interval | Outputs |
|---|---|
| fast | AC production, DC production |
| medium | total production (today, month, year, lifetime), production totals (Wh), inverter status |
| slow | inverter efficiency, CO2 avoided, solar potential (irradiance), sun position |
| night | everything |
The sampling rates may be modified in the YAML file in the settings.sampling options:
settings:
    sampling:
        fast:   10
        medium: 30
        slow:   60
        night:  900
All outputs are broadcast by MQTT, the InfluxDB code only includes selected topics, edit the topic table in influx.py output the desired sensors.
Data is organized in InfluxDB2 using the following schemas, refer to the Flux queries for examples of pulling data from InfluxDB2 for dashboard or other use.
AC production measurements:
    _measurement    ac_production
    _inverter       inverter name(s), site
    _field          power (W), current (A), voltage (V)

DC production measurements:
    _measurement    dc_production
    _inverter       inverter name(s), site
    _field          power (W), current (A), voltage (V)

Production measurements:
    _measurement    production
    _inverter       inverter name(s), site
    _field          total_wh, midnight (inverter total Wh meter)

Status measurements:
    _measurement    status
    _inverter       inverter name(s), site
    _field          condition, derating, grid_relay, operating_status

Sun/irradiance measurements:
    _measurement    sun
    _field          position
    _type           azimuth (degrees), elevation (degrees)

    _measurement    sun
    _field          irradiance
    _type           modeled (W/m²), measured (W/m²)

    _measurement    sun
    _field          temperature
    _type           working (°C), ambient (°C)
Some data points get stale quickly and can be deleted, the pruning tasks can be used to remove them. Here is an example pruning task that keeps the last 3 days of the status measurement:
  influxdb2:
    ...
    pruning:
      - task:
          name: 'status'
          predicate: '_measurement="pstatus"'
          keep_last: 3
You can have as many of these as desired, the sample YAML file has entries for the data that isn't needed to be stored for the long term.
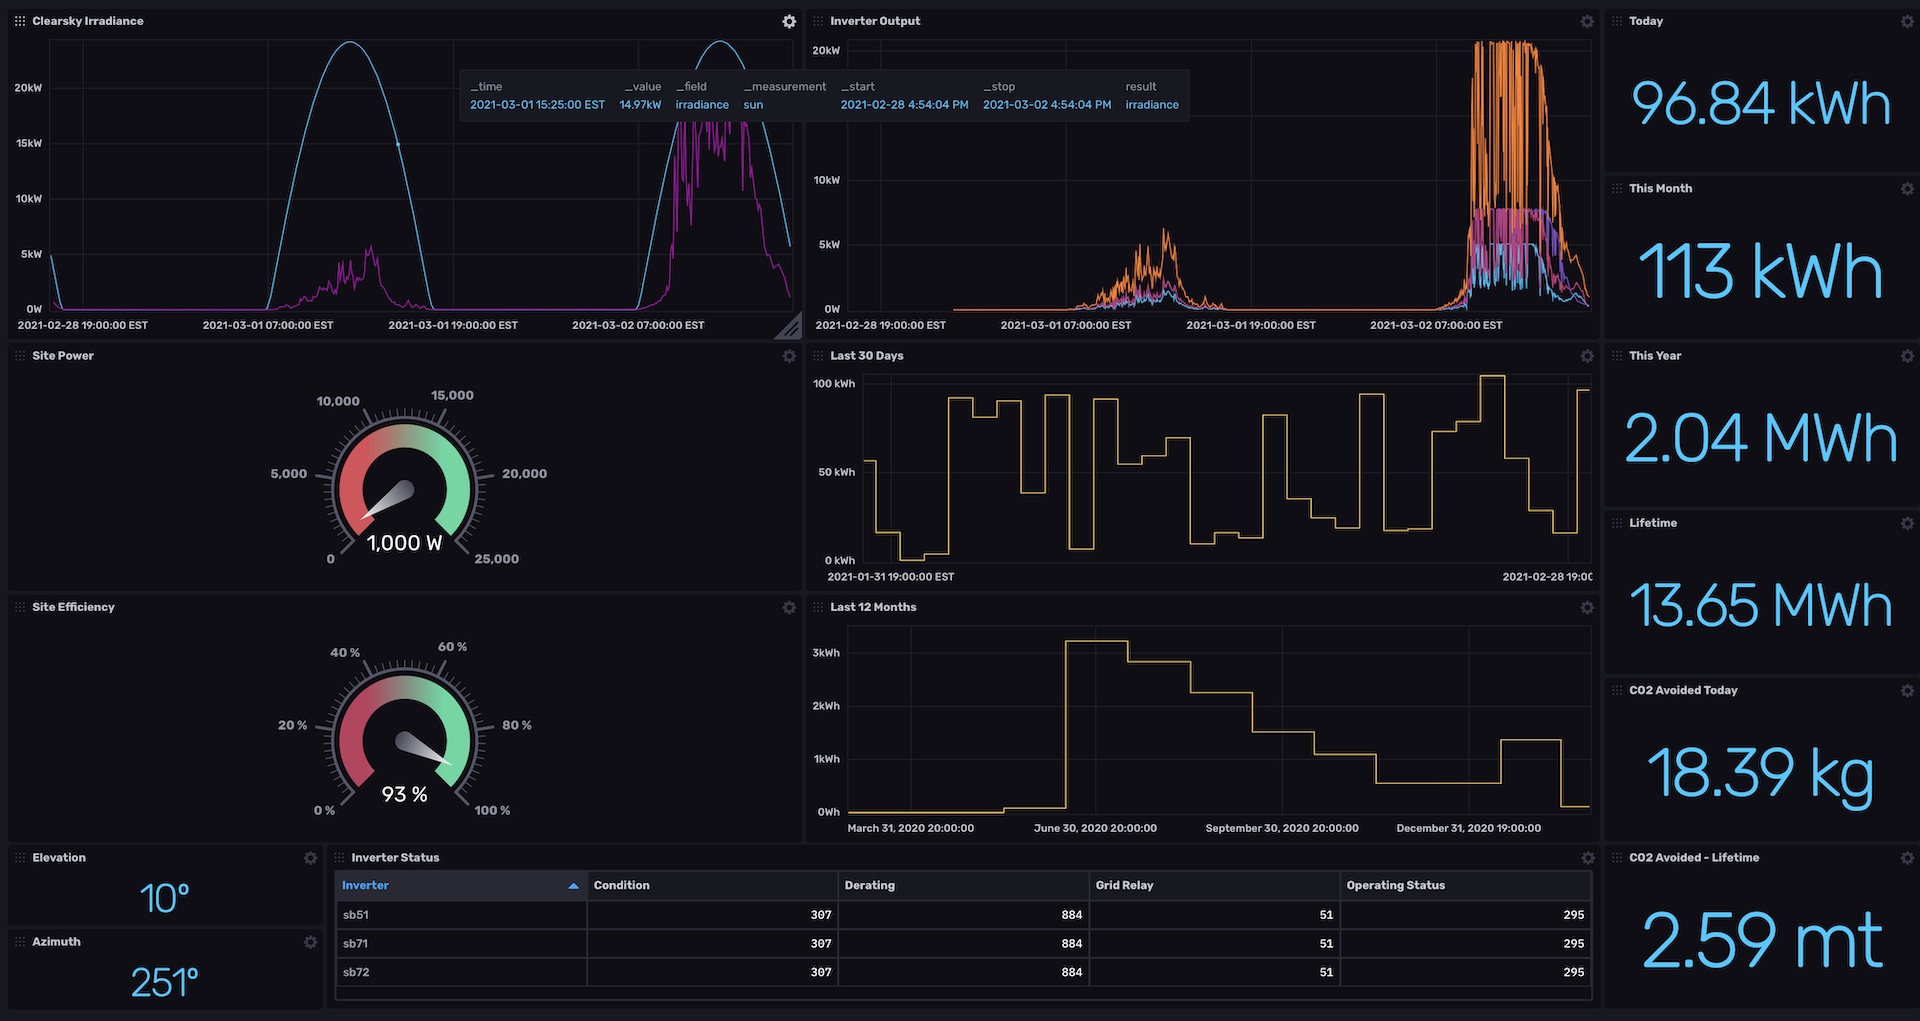
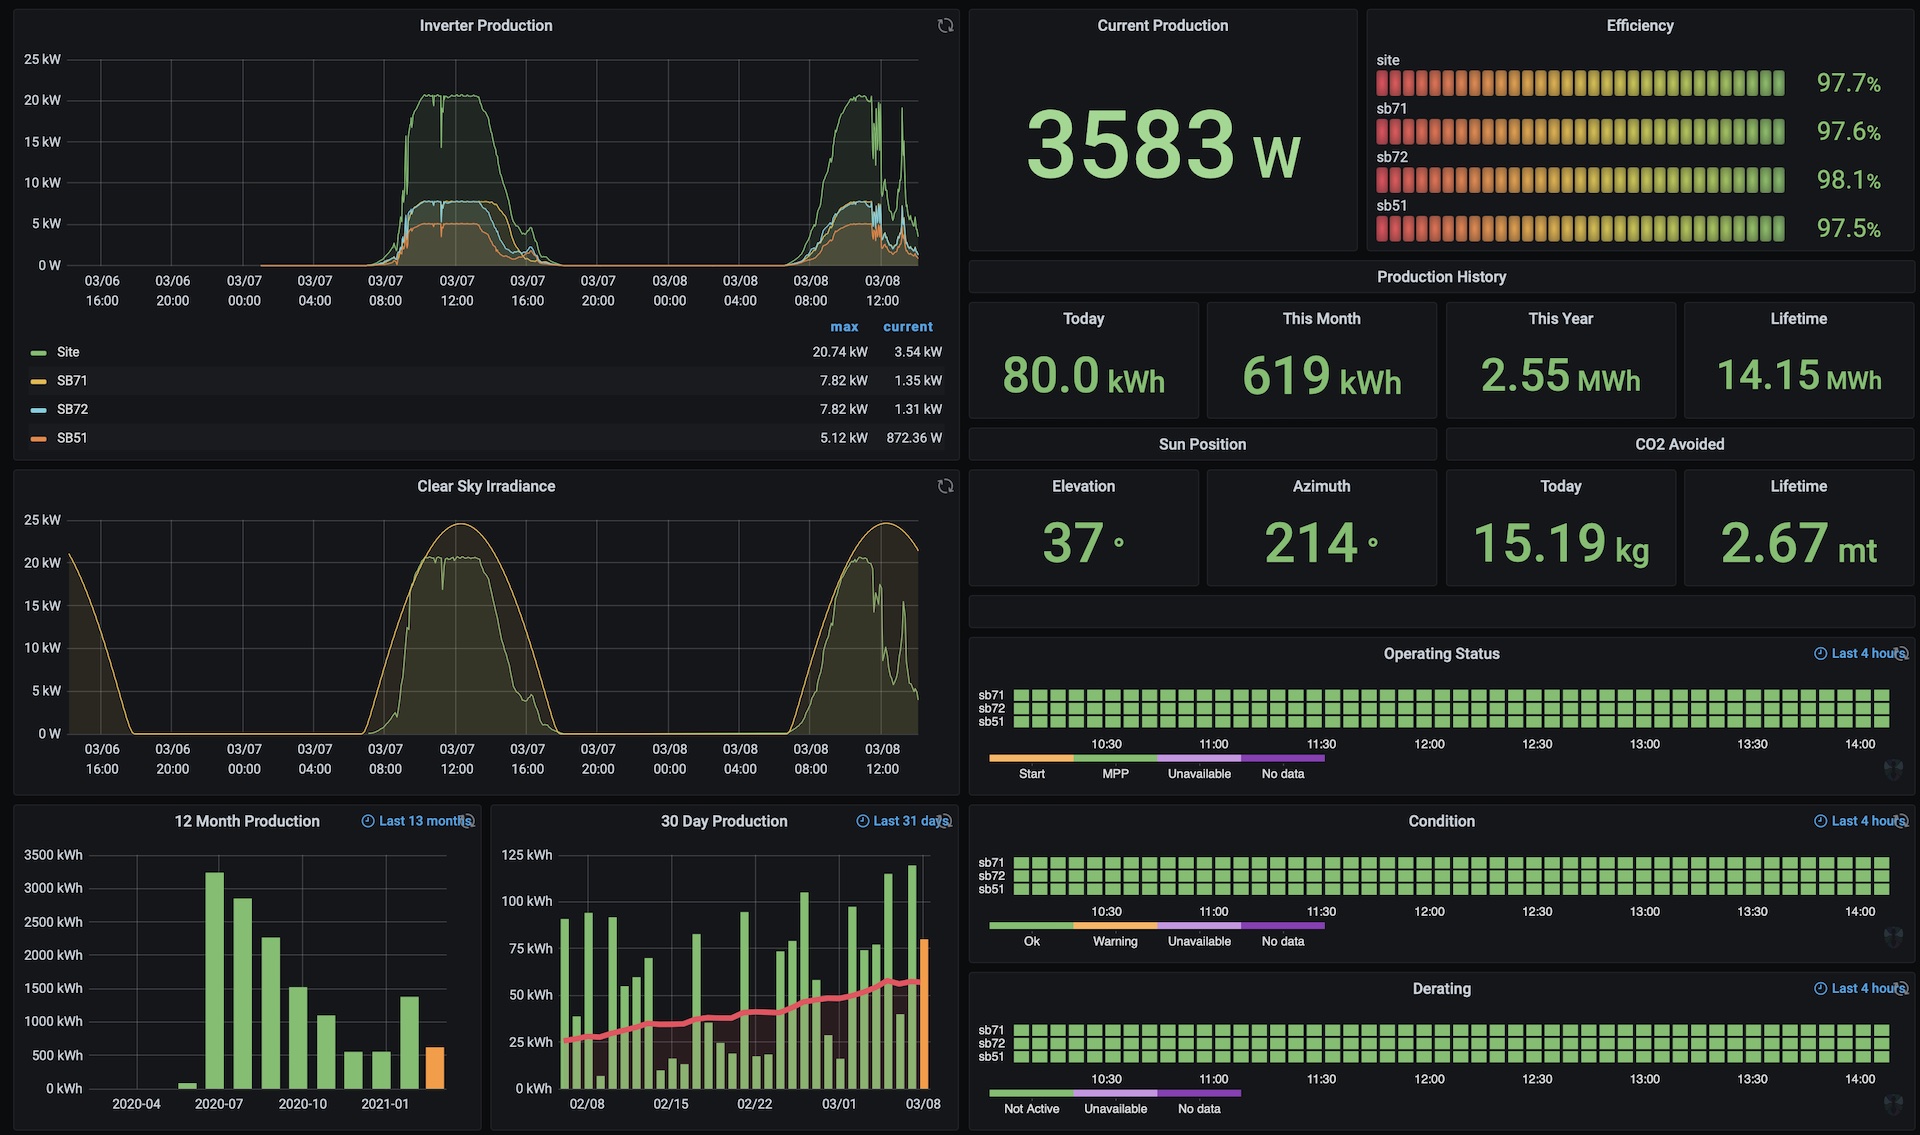
Example dashboards are provided for Grafana and InfluxDB2, the dashboards contain the Flux scripts used to query an InfluxDB2 bucket so be sure to examine them. If you are using InfluxDB 1.8.x it is supported by multisma2 but you will have to slightly modify the Grafana Flux scripts if you want to work in the InfluxDB 1.8 UI.
All InfluxDB2 queries are done in Flux, looked more intuitive to me since I never used SQL. Currently supporting InfluxDB 1.8.x and InfluxDB 2.0.x database output, only the settings in multisma2.yaml file need to change to use the older version.
InfluxDB2 visualizations don't really handle state outputs like the inverter status very well so just integer state returned by the inverter is displayed, Grafana on the other hand has a very nice Status Map visualization that works very well for this (but is broken in Grafana 8.1).
The dashboards now use dashboard variables to control the InfluxDB bucket used in all queries and the constants used in the clear sky irradiance panel to scale up the solar radiation in W/m2 for a particular site. These are located in the dashboard settings under Variables so be sure to check them out.
This dashboard uses the following Grafana panel plug-ins:
    grafana-cli plugins install flant-statusmap-panel
    grafana-cli plugins install mxswat-separator-panel
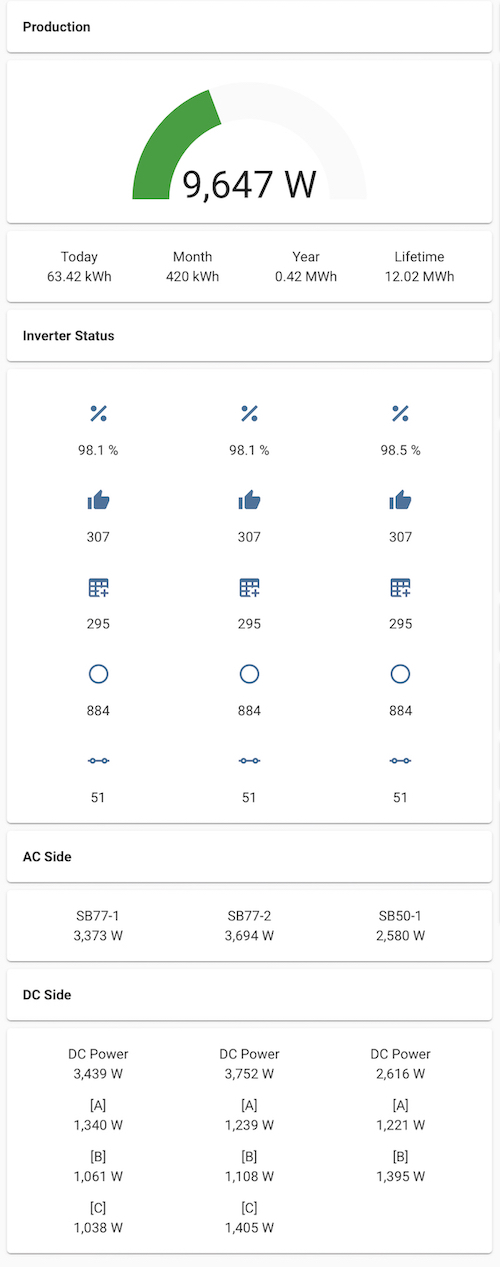
This last example is a dashboard made in Home Assistant driven by the MQTT output of multisma2.
If you happen to make errors and get locked out of your inverters (confirm by being unable to log into an inverter using the WebConnect browser interface), the Sunny Boy inverters can be reset by
- disconnect grid power from inverters (usually one or more breakers)
- disconnect DC power from the panels to the inverters (rotary switch on each inverter)
- wait 2 minutes
- restore DC power via each rotary switch
- restore grid power via breakers
Thanks for the following packages used to build this software:
- PYSMA library for WebConnect
- YAML configuration file support
- Astral solar calculator
- Tricks for managing startup and shutdown
- Chapter 7.9 (TOTAL CLEAR SKY INSOLATION ON A COLLECTING SURFACE) from from G. Masters, “Renewable and Efficient Electric Power Systems,” Wiley-IEEE Press, 2004


