seeing the max, rather than the average, on rrul is less distracting #225
Comments
|
|

|
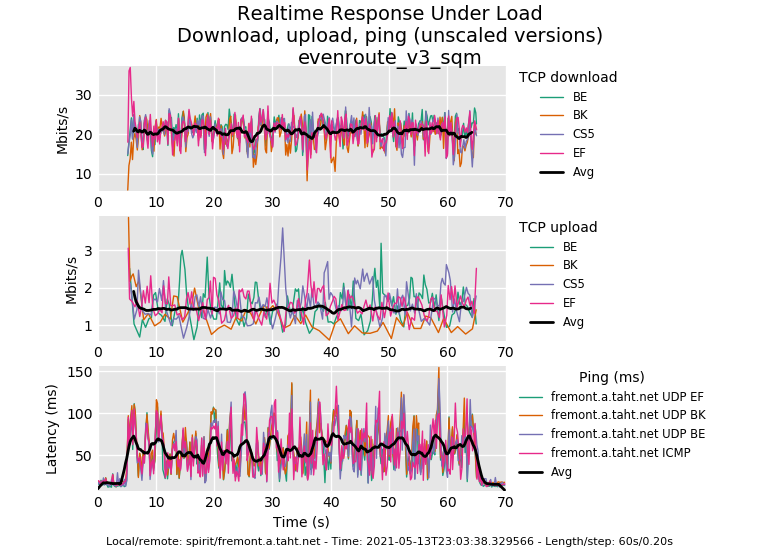
In other talks about voip, I've talked about this as "riding the sawtooth" |
|
As a stop-gap measure maybe not call it Avg, but "equitable throughput per flow" or something to direct the attention to the fact that this is useful to assess the fairness of capacity sharing and does not denote the aggregated throughput? |
|
Problem with just using the max is those outliers (like that last datapoint in TCP upload on the second plot). I suppose adding a variant of the ping plot where the bold black line rides on top of the plot instead of being an average? Is that what you mean? |
|
yes |
Sign up for free
to join this conversation on GitHub.
Already have an account?
Sign in to comment
Naive readers of a rrul plot tend to look at the average, when, especially when you are trying to describe the difference between a good plot of latency and jitter
a good sch_fq plot of latency and jitter
and
The Terrifying FQ_CODEL BQL BUG
To a manager type that wants to pull you off onto doing some irrelevant study of something of far less import to the correct behavior of 10s of millions of machines and of the internet itself and threatens to fire you if you are not going to comply... would help. rrul_max perhaps?
The text was updated successfully, but these errors were encountered: