阈值处理即图像二值化。是图像分割的一种最简单的方法。二值化可以把灰度图像转换成二值图像。把大于某个临界灰度值的像素灰度设为灰度极大值,把小于这个值的像素灰度设为灰度极小值,从而实现二值化。
简单阈值
ret, dst = cv2.threshold(src, thresh, maxval, type)参数意义如下:
-
src: 输入图,只能输入单通道图像,通常来说为灰度图
-
thresh: 阈值
-
maxval: 当像素值超过了阈值(或者小于阈值,根据type来决定),所赋予的值
-
type:二值化操作的类型,包含以下5种类型: cv2.THRESH_BINARY; cv2.THRESH_BINARY_INV; cv2.THRESH_TRUNC; cv2.THRESH_TOZERO;cv2.THRESH_TOZERO_INV
-
cv2.THRESH_BINARY :正向二值化,如果当前的像素值大于设置的阈值(thresh),则将该点的像素值设置为maxval;否则,将该点的像素值设置为0; 具体的公式如下: $$ \operatorname{dst}(x, y)=\left{\begin{array}{ll}{\max \text { val }} & {\text { if } \operatorname{src}(x, y)>\text { thresh }} \ {0} & {\text { otherwise }}\end{array}\right. $$
-
cv2.THRESH_BINARY_INV :反向二值化,如果当前的像素值大于设置的阈值(thresh),则将该点的像素值设置为0;否则,将该点的像素值设置为maxval; 具体的公式如下: $$ \operatorname{dst}(x, y)=\left{\begin{array}{ll}{0} & {\text { if } \operatorname{src}(x, y)>\text { thresh }} \ {\text { maxval }} & {\text { otherwise }}\end{array}\right. $$
-
cv2.THRESH_TRUNC :如果当前的像素值大于设置的阈值(thresh),则将该点的像素值设置为threshold;否则,将该点的像素值不变; 具体的公式如下: $$ \operatorname{dst}(x, y)=\left{\begin{array}{ll}{\text { threshold }} & {\text { if } \operatorname{src}(x, y)>\text { thresh }} \ {\operatorname{src}(x, y)} & {\text { otherwise }}\end{array}\right. $$
-
cv2.THRESH_TOZERO :如果当前的像素值大于设置的阈值(thresh),则将该点的像素值不变;否则,将该点的像素值设置为0; 具体的公式如下: $$ \operatorname{dst}(x, y)=\left{\begin{array}{ll}{\operatorname{src}(x, y)} & {\text { if } \operatorname{src}(x, y)>\text { thresh }} \ {0} & {\text { otherwise }}\end{array}\right. $$
-
cv2.THRESH_TOZERO_INV:如果当前的像素值大于设置的阈值(thresh),则将该点的像素值设置为0;否则,将该点的像素值不变; 具体的公式如下: $$ \operatorname{dst}(x, y)=\left{\begin{array}{ll}{0} & {\text { if } \operatorname{src}(x, y)>\text { thresh }} \ {\operatorname{src}(x, y)} & {\text { otherwise }}\end{array}\right. $$
例子
def cv_show(name,image):
    """图像显示函数
    name:字符串,窗口名称
    img:numpy.ndarray,图像
    """
    cv2.namedWindow(name,cv2.WINDOW_NORMAL)
    cv2.imshow(name,image)
    cv2.waitKey(0)
    cv2.destroyAllWindows()

def img_show(name,image):
    """matplotlib图像显示函数
    name:字符串,图像标题
    img:numpy.ndarray,图像
    """
    if len(image.shape) == 3:
        image = cv2.cvtColor(image,cv2.COLOR_BGR2RGB)
    plt.imshow(image,'gray')
    plt.xticks([])
    plt.yticks([])
    plt.xlabel(name,fontproperties='FangSong',fontsize=12)
if __name__=="__main__":

    image = cv2.imread('data/Pavlovsk_Railing_of_bridge_Yellow_palace_Winter.jpg')
    gray = cv2.cvtColor(image,cv2.COLOR_BGRA2GRAY)
    blurred = cv2.GaussianBlur(gray,(5,5),0)
    #('original image',image)

    (T,thresh_inv) = cv2.threshold(blurred,127,255,cv2.THRESH_BINARY_INV)
    #cv_show('original image',thresh_inv)
    image_mask = cv2.bitwise_and(gray,gray,mask = thresh_inv)
    #color = cv2.cvtColor(image_mask,cv2.COLOR_GRAY2BGR)

    #cv_show('image_mask',image_mask)

    plt.figure(figsize=(10,8),dpi=100)
    plt.subplot(131)
    img_show('original image',image)
    plt.subplot(132)
    img_show('thresh_inv',thresh_inv)
    plt.subplot(133)
    img_show('image_mask',image_mask)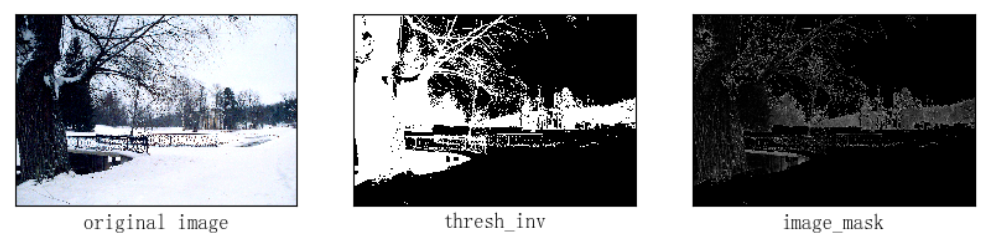
自适应阈值
在前面的部分我们使用是全局阈值,整幅图像采用同一个数作为阈值。当时这种方法并不适应与所有情况,尤其是当同一幅图像上的不同部分的具有不同亮度时。这种情况下我们需要采用自适应阈值。此时的阈值是根据图像上的 每一个小区域计算与其对应的阈值。因此,在同一幅图像上的不同区域采用的不同的阈值,从而使我们能在亮度不同的情况下得到更好的结果。这种方法需要我们指定三个参数,返回值只有一个。
cv2.adaptiveThreshold(src, maxValue, adaptiveMethod, thresholdType, blockSize, C)
参数意义如下:
-
src:原图,即输入图像,是一个8位单通道的图像;
-
maxValue:分配给满足条件的像素的非零值;
-
adaptiveMethod:自适应阈值的方法,通常有以下几种方法;
(1)ADAPTIVE_THRESH_MEAN_C,阈值T(x,y)是(x,y)减去C的Blocksize×Blocksize邻域的平均值。
(2)ADAPTIVE_THRESH_GAUSSIAN_C ,阈值T(x,y)是(x,y)减去C的Blocksize×Blocksize邻域的加权和(与高斯相关),默认sigma(标准差)用于指定的Blocksize;具体的情况可以参见getGaussianKernel函数;
-
thresholdType:阈值的类型必须是以下两种类型,
(1)THRESH_BINARY,正向二值化
(2)THRESH_BINARY_INV ,反向二值化
-
blockSize:像素邻域的大小,用来计算像素的阈值,blockSize必须为奇数,例如,3,5,7等等;
-
C:从平均数或加权平均数减去常量。通常,它是正的,但也可能是零或负数。
例子
def img_show(name,image):
    """matplotlib图像显示函数
    name:字符串,图像标题
    img:numpy.ndarray,图像
    """
    if len(image.shape) == 3:
        image = cv2.cvtColor(image,cv2.COLOR_BGR2RGB)
    plt.imshow(image,'gray')
    plt.xticks([])
    plt.yticks([])
    plt.xlabel(name,fontproperties='FangSong',fontsize=12)
if __name__=="__main__":

    image = cv2.imread('data/text1.png')
    gray = cv2.cvtColor(image,cv2.COLOR_BGRA2GRAY)

    blurred = cv2.medianBlur(gray,1)
    #('original image',image)

    (T,thresh) = cv2.threshold(blurred,127,255,cv2.THRESH_BINARY)
    #cv_show('original image',thresh_inv)
    th1 = cv2.adaptiveThreshold(gray,255,
    cv2.ADAPTIVE_THRESH_MEAN_C,cv2.THRESH_BINARY,11,2)
    th1_1 = cv2.medianBlur(th1,5)
    th2 = cv2.adaptiveThreshold(gray,255,
    cv2.ADAPTIVE_THRESH_GAUSSIAN_C,cv2.THRESH_BINARY,11,2)

    #color = cv2.cvtColor(image_mask,cv2.COLOR_GRAY2BGR)

    #cv_show('image_mask',image_mask)

    plt.figure(figsize=(7,10),dpi=100)
    plt.subplot(221)
    img_show('Original Image',gray)
    plt.subplot(222)
    img_show('Global Thresholding (v = 127)',thresh)
    plt.subplot(223)
    img_show('Adaptive Mean Thresholding',th1_1)
    plt.subplot(224)
    img_show('Adaptive Gaussian Thresholding',th2)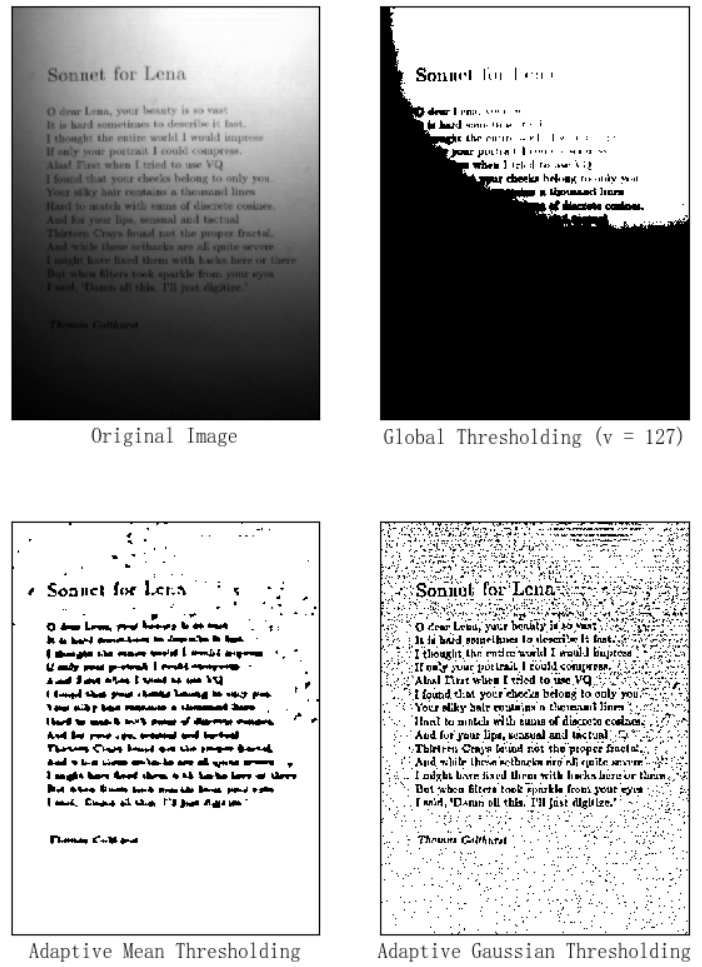
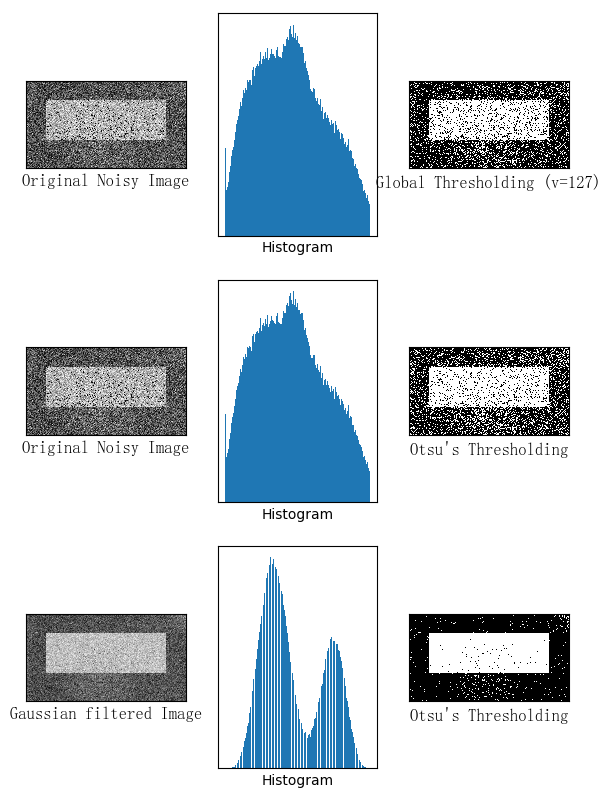
OTSU(大津算法)
OTSU用来自动对基于聚类的图像进行二值化,或者说,将一个灰度图像退化为二值图像。该算法以大津展之命名。该算法假定该图像根据双模直方图(前景像素和背景像素)把包含两类像素,于是它要计算能将两类分开的最佳阈值,使得它们的类内方差最小;由于两两平方距离恒定,所以即它们的类间方差最大。
下面的例子中,输入图像是一副带有噪声的图像。第一种方法,我们设127 为全局阈值。第二种方法,我们直接使用 Otsu 二值化。第三种方法,我们首先使用一个 5x5 的高斯核除去噪音,然后再使用 Otsu 二值化。看看噪音 去除对结果的影响有多大吧。
例子
def img_show(name,image):
    """matplotlib图像显示函数
    name:字符串,图像标题
    img:numpy.ndarray,图像
    """
    if len(image.shape) == 3:
        image = cv2.cvtColor(image,cv2.COLOR_BGR2RGB)
    plt.imshow(image,'gray')
    plt.xticks([])
    plt.yticks([])
    plt.xlabel(name,fontproperties='FangSong',fontsize=12)

if __name__=="__main__":

    image = cv2.imread('data/noise.jpg')

    gray = cv2.cvtColor(image,cv2.COLOR_BGRA2GRAY)
    gray[100:300,100:700]=gray[100:300,100:700]+100
    (T,thresh) = cv2.threshold(gray,127,255,cv2.THRESH_BINARY)
    #cv_show('original image',thresh_inv)
    (T,th1) = cv2.threshold(gray,127,255,cv2.THRESH_BINARY+cv2.THRESH_OTSU)
    blurred = cv2.GaussianBlur(gray,(5,5),0)

    (T,th2) = cv2.threshold(blurred,127,255,cv2.THRESH_BINARY+cv2.THRESH_OTSU)

    #color = cv2.cvtColor(image_mask,cv2.COLOR_GRAY2BGR)

    #cv_show('image_mask',image_mask)
    images = [gray, 0, thresh,gray, 0, th1,blurred, 0, th2]
    titles = ['Original Noisy Image','Histogram','Global Thresholding (v=127)',
              'Original Noisy Image','Histogram',"Otsu's Thresholding",
              'Gaussian filtered Image','Histogram',"Otsu's Thresholding"]
    plt.figure(figsize=(7,10),dpi=100)
    for i in range(3):
        plt.subplot(3,3,i*3+1)
        img_show(titles[i*3],images[i*3])
        plt.subplot(3,3,i*3+2)
        plt.hist(images[i*3].ravel(),256)
        plt.xlabel(titles[i*3+1])
        plt.xticks([])
        plt.yticks([])
        plt.subplot(3,3,i*3+3)
        img_show(titles[i*3+2],images[i*3+2])