Azure Databricks has some native integration with Azure Monitor that allows customers to track workspace-level events in Azure Monitor. However, many customers want a deeper view of the activity within Databricks. This repo presents a solution that will send much more detailed information about the Spark jobs running on Databricks clusters over to Azure Monitor. This allows organizations to use the same reporting and alerting features in Azure Monitor that they use for other services to be applied to activities within Databricks.
This solution includes two distinct components:
-
Copy Spark logs managed by Log4J to Log Analytics, which will help you get your logs to a centralized location.
-
Send both standard and custom metrics about Spark jobs to Application Insights. This is accomplished by attaching a custom Spark Listener to your Databricks clusters.
These two components can be implemented independently of each other, based on your needs. It should be noted that Log4J is quite verbose, and for large Databricks deployments, it can be expensive to import so much logging data into Log Analytics.
Follow the steps below to configure the solution in your environment.
- Create Application Insights in Azure
- Get your instrumentation key on the overview page
- Enter
APPINSIGHTS_INSTRUMENTATIONKEYin theappinsights_logging_init.shscript
- Create a Log Analytics account in Azure
- Get your workspace id on the overview page
- Get your primary key by clicking Advanced Settings >> Connected Sources >> Linux and copy primary key
- Enter
LOG_ANALYTICS_WORKSPACE_IDin theappinsights_logging_init.shscript - Enter
LOG_ANALYTICS_PRIMARY_KEYin theappinsights_logging_init.shscript - Get your primary key by clicking Advanced Settings >> Data >> Linux Performace Counters and click "Apply below configuration to my machines" then press Save
- Click the Add button (The UI should turn to a grid) then press Save
-
Create Databricks workspace in Azure
-
Install Databricks CLI on your local machine
-
Open your Azure Databricks workspace, click on the user icon, and create a token
-
Run
databricks configure --tokenon your local machine to configure the Databricks CLI -
Run
Upload-Items-To-Databricks.sh- Change the extension to
.batfor Windows). - On Linux you will need to do a
chmod +xon this file to run.
This will copy the
.jarfiles and init script from this repo to the DBFS in your Databricks workspace. - Change the extension to
-
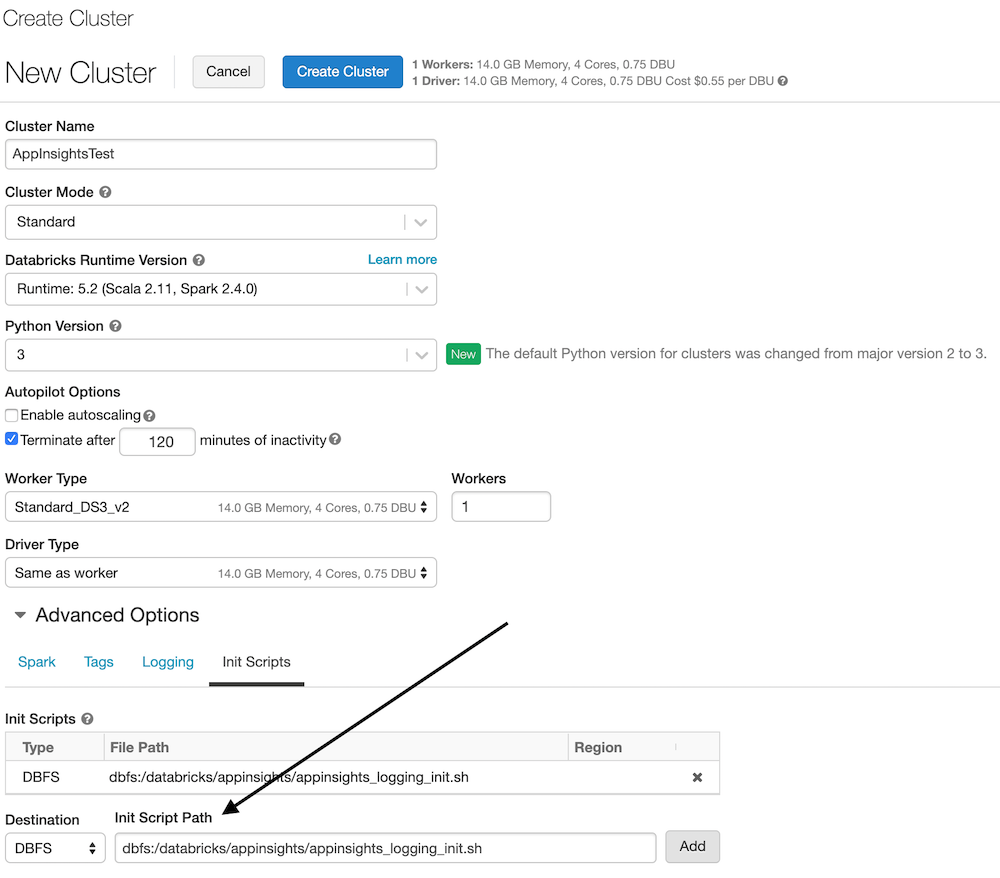
Create a cluster in Databricks (any size and shape is fine)
- Make sure you click Advanced Options and "Init Scripts"
- Add a script for "dbfs:/databricks/appinsights/appinsights_logging_init.sh"
-
Start the cluster
-
OPTIONAL Install the
applicationsightsPython package from PyPi to the cluster.- This provides the ability to send custom events and metrics to app insights.
- You'll need to follow this step if you plan on logging Custom Metrics or Events to App Insights on Pyspark.
- Steps to install a library on Azure Databricks
- Import the notebooks in the
AppInsightsTest.dbcfile - Run the AppInsightsTest Scala notebook
- Cell 1 displays your application insights key
- Cell 2 displays your jars (application insights jars should be in here)
- Cell 3 displays your log4j.properities file on the "driver" (which has the aiAppender)
- Cell 4 displays your log4j.properities file on the "executor" (which has the aiAppender)
- Cell 5 writes to Log4J so the message will appear in App Insights
- Cell 6 writes to App Insights via the App Insights API. This will show as a "Custom Event" (customEvents table).
- OPTIONAL Run the AppInsightsPython Python notebook
- Cell 1 creates a reference to the Log4J logger (called aiAppender) and writes to Log4J so the message will appear in App Insights.
- Cell 2 configures the connection to App Insights via the
appinsightspackage. - Cell 3 writes to App Insights via the App Insights API. This will show as a "Custom Event" (customEvents table).
- Open your App Insights account in the Azure Portal
- Click on Search (top bar or left menu)
- Click Refresh (over and over until you see data)
- For a new App Insights account this can take 10 to 15 minutes to really initialize
- For an account that is initialized expect a 1 to 3 minute delay for telemetry
-
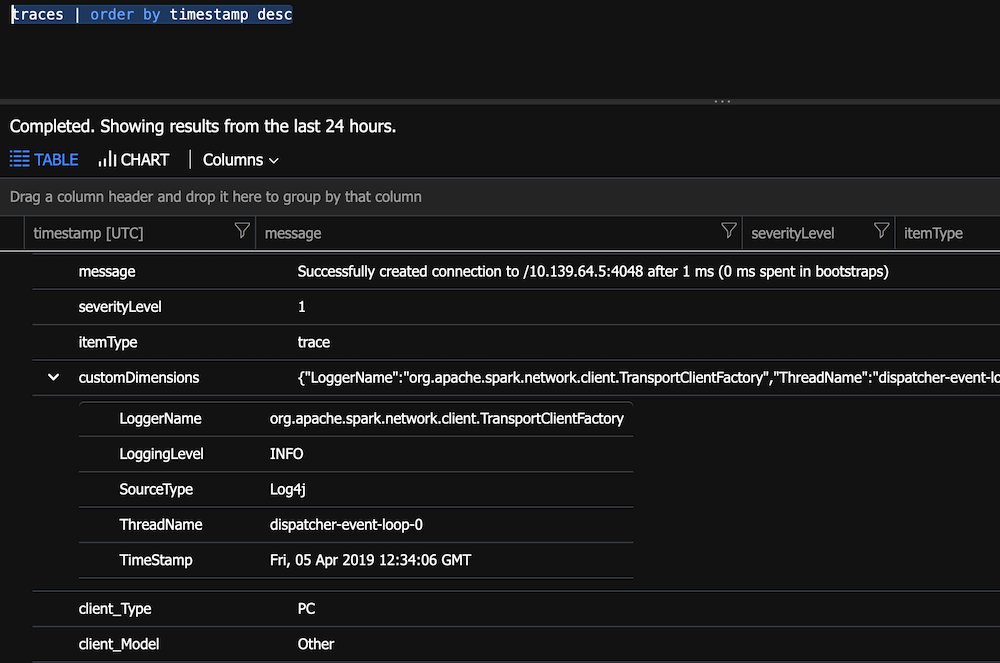
The data will come into App Insights as a Trace
-
This means the data will be in the customDimensions field as a property bag
-
Open the Analytic query for App Insights
-
Run
traces | order by timestamp desc- You will notice how customDimensions contains the fields
-
Parse the custom dimensions. This will make the display easier.
traces
| project
  message,
  severityLevel,
  LoggerName=customDimensions["LoggerName"],
  LoggingLevel=customDimensions["LoggingLevel"],
  SourceType=customDimensions["SourceType"],
  ThreadName=customDimensions["LoggingLevel"],
  SparkTimestamp=customDimensions["TimeStamp"],
  timestamp
| order by timestamp desc

- Run
customEvents | order by timestamp descto see the custom event your Notebook wrote - Run
customMetrics | order by timestamp descto see the HeartbeatState - Don't know which field has your data:
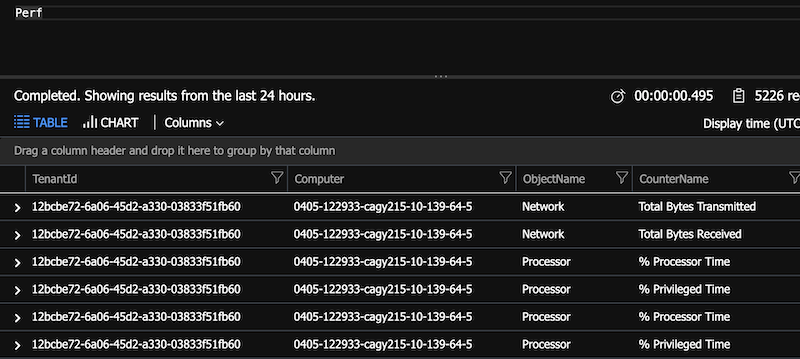
traces | where * contains "App Insights on Databricks" - Open your Log Analytics account
- Click on Logs
- Write a query against the Perf and/or Heartbeat tables
Install the custom Scala Listener on your cluster to automatically send Spark job events to Application Insights.
- For query help see: https://docs.microsoft.com/en-us/azure/kusto/query/
- Show this data in Power BI: https://docs.microsoft.com/en-us/azure/azure-monitor/app/export-power-bi
- You can pin your queries to an Azure Dashboard: https://docs.microsoft.com/en-us/azure/azure-monitor/app/app-insights-dashboards
- You can configure continuous export your App Insights data and send to other systems. Create a Stream Analytics job to monitor the exported blob location and send from there.
- Set up alerts: https://docs.microsoft.com/en-us/azure/azure-monitor/platform/alerts-log-query
- You can get JMX metrics: https://docs.microsoft.com/en-us/azure/azure-monitor/app/java-get-started#performance-counters. You will need an ApplicationInsights.XML file: https://github.com/Microsoft/ApplicationInsights-Java/wiki/ApplicationInsights.XML. You probably need to upload this to DBFS and then copy in the appinsights_logging_init.sh to the cluster. (I have not yet tested this setup.)