-
Notifications
You must be signed in to change notification settings - Fork 70
Gazebo ROS Ray Sensors
Key points about Gazebo ROS Ray sensors:
- ROS provides four ray sensors:
- gazebo_ros_laser - This publishes
sensor_msgs/LaserScan, one horizontal scan from the center vertical ray, rather than asensor_msgs/PointCloud2containing multiple rows. - gazebo_ros_gpu_laser - Same as gazebo_ros_laser, but is faster because it uses the GPU to identify points reflected from graphics information rather than from physics information.
- gazebo_ros_block_laser - Publishes
sensor_msgs/PointCloud. - gazebo_ros_range - Returns the minimum range value rather than
sensor_msgs/PointCloud2.
- gazebo_ros_laser - This publishes
- Ray sensors calculate reflection length and intensity by identifying collision points along a straight line.
- Collision objects may be one of either Physics (non-gpu) or graphics (gpu).
- In ROS 2, there is one plugin for all of this: gazebo_ros_ray_sensor. Select ray or gpu_ray for detection approach. Select output_type, one of
Range,LaserScan,PointCloud, orPointCloud2, for the desired output. They are all compatible with GPU or Physics-based sensing.
Gazebo ROS Ray sensors publish these messages:
- gazebo_ros_range:
sensor_msgs/Range: The closest distance in the scan. - gazebo_ros_laser, gazebo_ros_gpu_laser:
sensor_msgs/LaserScan: One horizontal scan from the center vertical ray. - gazebo_ros_block_laser:
sensor_msgs/PointCloud,sensor_msgs/PointCloud2: The point cloud of range and retro values given a height, width, scan angle, and horizontal angle.
Links:
- Documentation about ROS Ray sensors: https://github.com/ros-simulation/gazebo_ros_pkgs/wiki/ROS-2-Migration:-Ray-sensors.
- Code: https://github.com/ros-simulation/gazebo_ros_pkgs under gazebo_plugins.
- Gazebo ROS Plugin tutorial: http://gazebosim.org/tutorials?tut=ros_gzplugins.
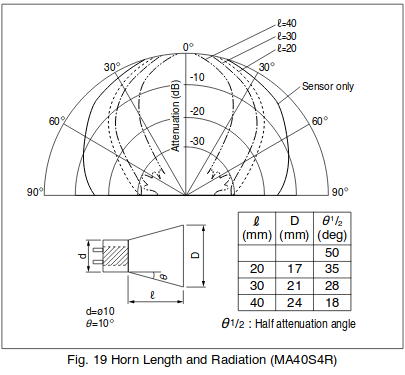
The gazebo_ros_block_laser sensor identifies length and retro values along straight lines by performing horizontal and vertical sweeps to produce a point cloud from which shape can be inferred. Sonar, unlike laser, spreads out in distance and weakens as it spreads. To model sonar with the gazebo_ros_block_laser plugin, we turn the point cloud into a sonar ray trace sweep. This drawing (from http://www.ee.columbia.edu/~kinget/EE6350_S14/DM6350_web/files/murata.pdf) shows beam power based on angle:

This drawing shows how the point cloud from the gazebo_ros_block_laser plugin can be used to simulate ultrasound:

Note that the output of this algorithm is a LaserScan rather than a PointCloud; it is a ray trace along a line and does not have a vertical component.
Here are some approaches we can take to improve Sonar realism:
- Adjust sensor ray parameters, see http://sdformat.org/spec?ver=1.7&elem=sensor. Here we define the horizontal and vertical angular widths and the number of rays horizontally and vertically. Each ray contributes a point to the point cloud.
- Convert the point-cloud to a 2-dimensional view. Here we apply randomization and coloring algorithms to make the point cloud look like a particular 2D Sonar view.
- Calculate a sonar ray trace from a laser point cloud (proposed here).
- Currently, values returned for range and retro are the average of four points along the horizontal and vertical grid requested, specifically the requested point, the point to the right, the point below, and the point below and to the right. We may want to remove this processing.
- If we wanted to model ray reflections, we would simulate sonar transmitters at points of reflections, see gazebo/physics/ode/ODEMultiRayShape.cc where it calls SetLength and SetRetro on RayShape.
The P900 series BlueView 2D Imaging Sonar does not have a round pattern of power decay based on angle as suggested in the diagram above. Based on their Spec sheet, https://seatronics-group.com/files/6714/1926/6524/Teledyne_Blueview_P900_Series_Sonar_-_Datasheet.pdf, the beam width is 1° x 20°. The P900-45 offers a 45° field of view for 512 beams with a beam spacing of 0.18° and max range of 100 m. It would be nice to see a power chart for the P900. It may be possible to calculate these values using equations, for example www.fao.org/3/x5818e05.htm Figure 31a and Figure 32.