-
diskusage.sh- Checks the disk usage of a particular mount point and outputs it to a specified csv file as YYMMDD,diskusage (ie: 20161214,21452214). If run every day, this can be useful for tracking your usage in excel or libreCalc in a pretty graph.diskusage.shmust be run daily to accurately calculate the growth average over time when paired withestimatefull.sh. The more times this script is run, the more accurate it should become due to the fluctuations in disk usage. -
estimatefull.sh- Approximates when your disk will be full based on your growth average (Which is generated using the csv file).diskusage.shmust be run daily to accurately calculate the growth average over time. -
DUOT.conf- Specify log locations and partition to monitor. Logs written to bydiskusage.shandmonthlyusage.sh. Logs read byestimatefull.sh. -
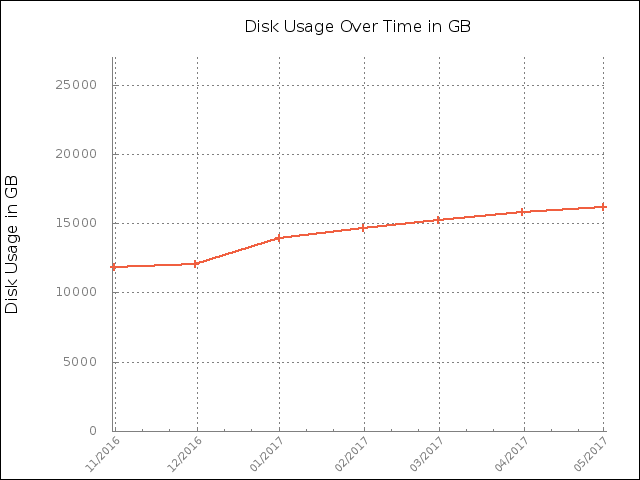
monthlyusage.sh- Checks disk usage of mount point specified inDUOT.confand outputs results into specified log asYYYY-MM-DD diskusage(2016-11-01 11834). Run monthly in a cron. Best used in association with gnuplot (demonstration below).
root@localhost:/# tail /var/log/usageovertimeV2.csv
20170508,16512
20170509,16457
20170510,16479
20170511,16539
20170512,16598
20170513,16618
20170514,16673
20170515,16710
20170516,16727
20170517,16775
root@localhost:/# ./estimatefull.sh
Estimated date disk will be full: September 08 2018
Example monthly log.
root@localhost:/# tail /var/log/usageovertime.monthly.dat
2016-11-01 11834
2016-12-01 12086
2017-01-01 13938
2017-02-01 14632
2017-03-01 15207
2017-04-01 15784
2017-05-01 16160
Install gnuplot and run the following command to get an SVG file that demonstrates past usage.
root@localhost:/# gnuplot -p -e '
set title "Disk Usage Over Time in GB";
set object 1 rectangle from screen 0,0 to screen 1,1 fillcolor rgb "white" behind;
set ylabel "Disk Usage in GB";
set yrange[0:AAAAA];
set ytics font ", 10";
set key off;
set xdata time;
set xtics font ", 8";
set xtics rotate by 45 offset -2.5,-1.5;
set format x "%m/%Y";
set tics nomirror;
set timefmt "%Y-%m-%d";
set bmargin 2.5;
set style line 11 lc rgb "#808080" lt 1;
set border 3 back ls 11;
set style line 12 lc rgb "#808080" lt 0 lw 1;
set grid back ls 12;
set term svg enhanced size 640,480;
set encoding iso_8859_1;
set output "out.svg";
plot "/var/log/usageovertime.monthly.dat" using 1:2 w lp pt 1 ps 1 lt 1 lc rgb "#f05F40" lw 2'
Substitute AAAAA for a max value on the Y Axis.
Substitute /var/log/usageovertime.month.dat for your results file from monthlyusage.sh.
Change the LOG and DISK variable accordingly in DUOT.conf
LOG=/root/usageovertime.csv                 # Where daily disk usage is logged
MONTHLYLOG=/root/usageovertime.monthly.dat  # Where disk usage at the beginning of the month is logged
DISK=/mnt/mymountpoint                      # The mountpoint to be checked. In the form of a directory, not device
