To explore the relationships between population size, population mobility, and GDP across Chinese provinces, this project creates a big data dashboard based on provincial GDP data, population data from 2000-2020, and Amap's annual migration data from June 2018 to November 2021, using the Vue framework for analysis.
- First, clone the project to your local
git clone https://github.com/LYL010-ADELA/Visualization-of-China-s-GDP-and-Population-Data-over-the-Years.git. cd Visualization-of-China-s-GDP-and-Population-Data-over-the-Yearsto enter the project directory.- Open terminal and enter
npm installto download required framework plugins.
- Open terminal and enter
npm run serveto run - Access by default through http://localhost:8080
-
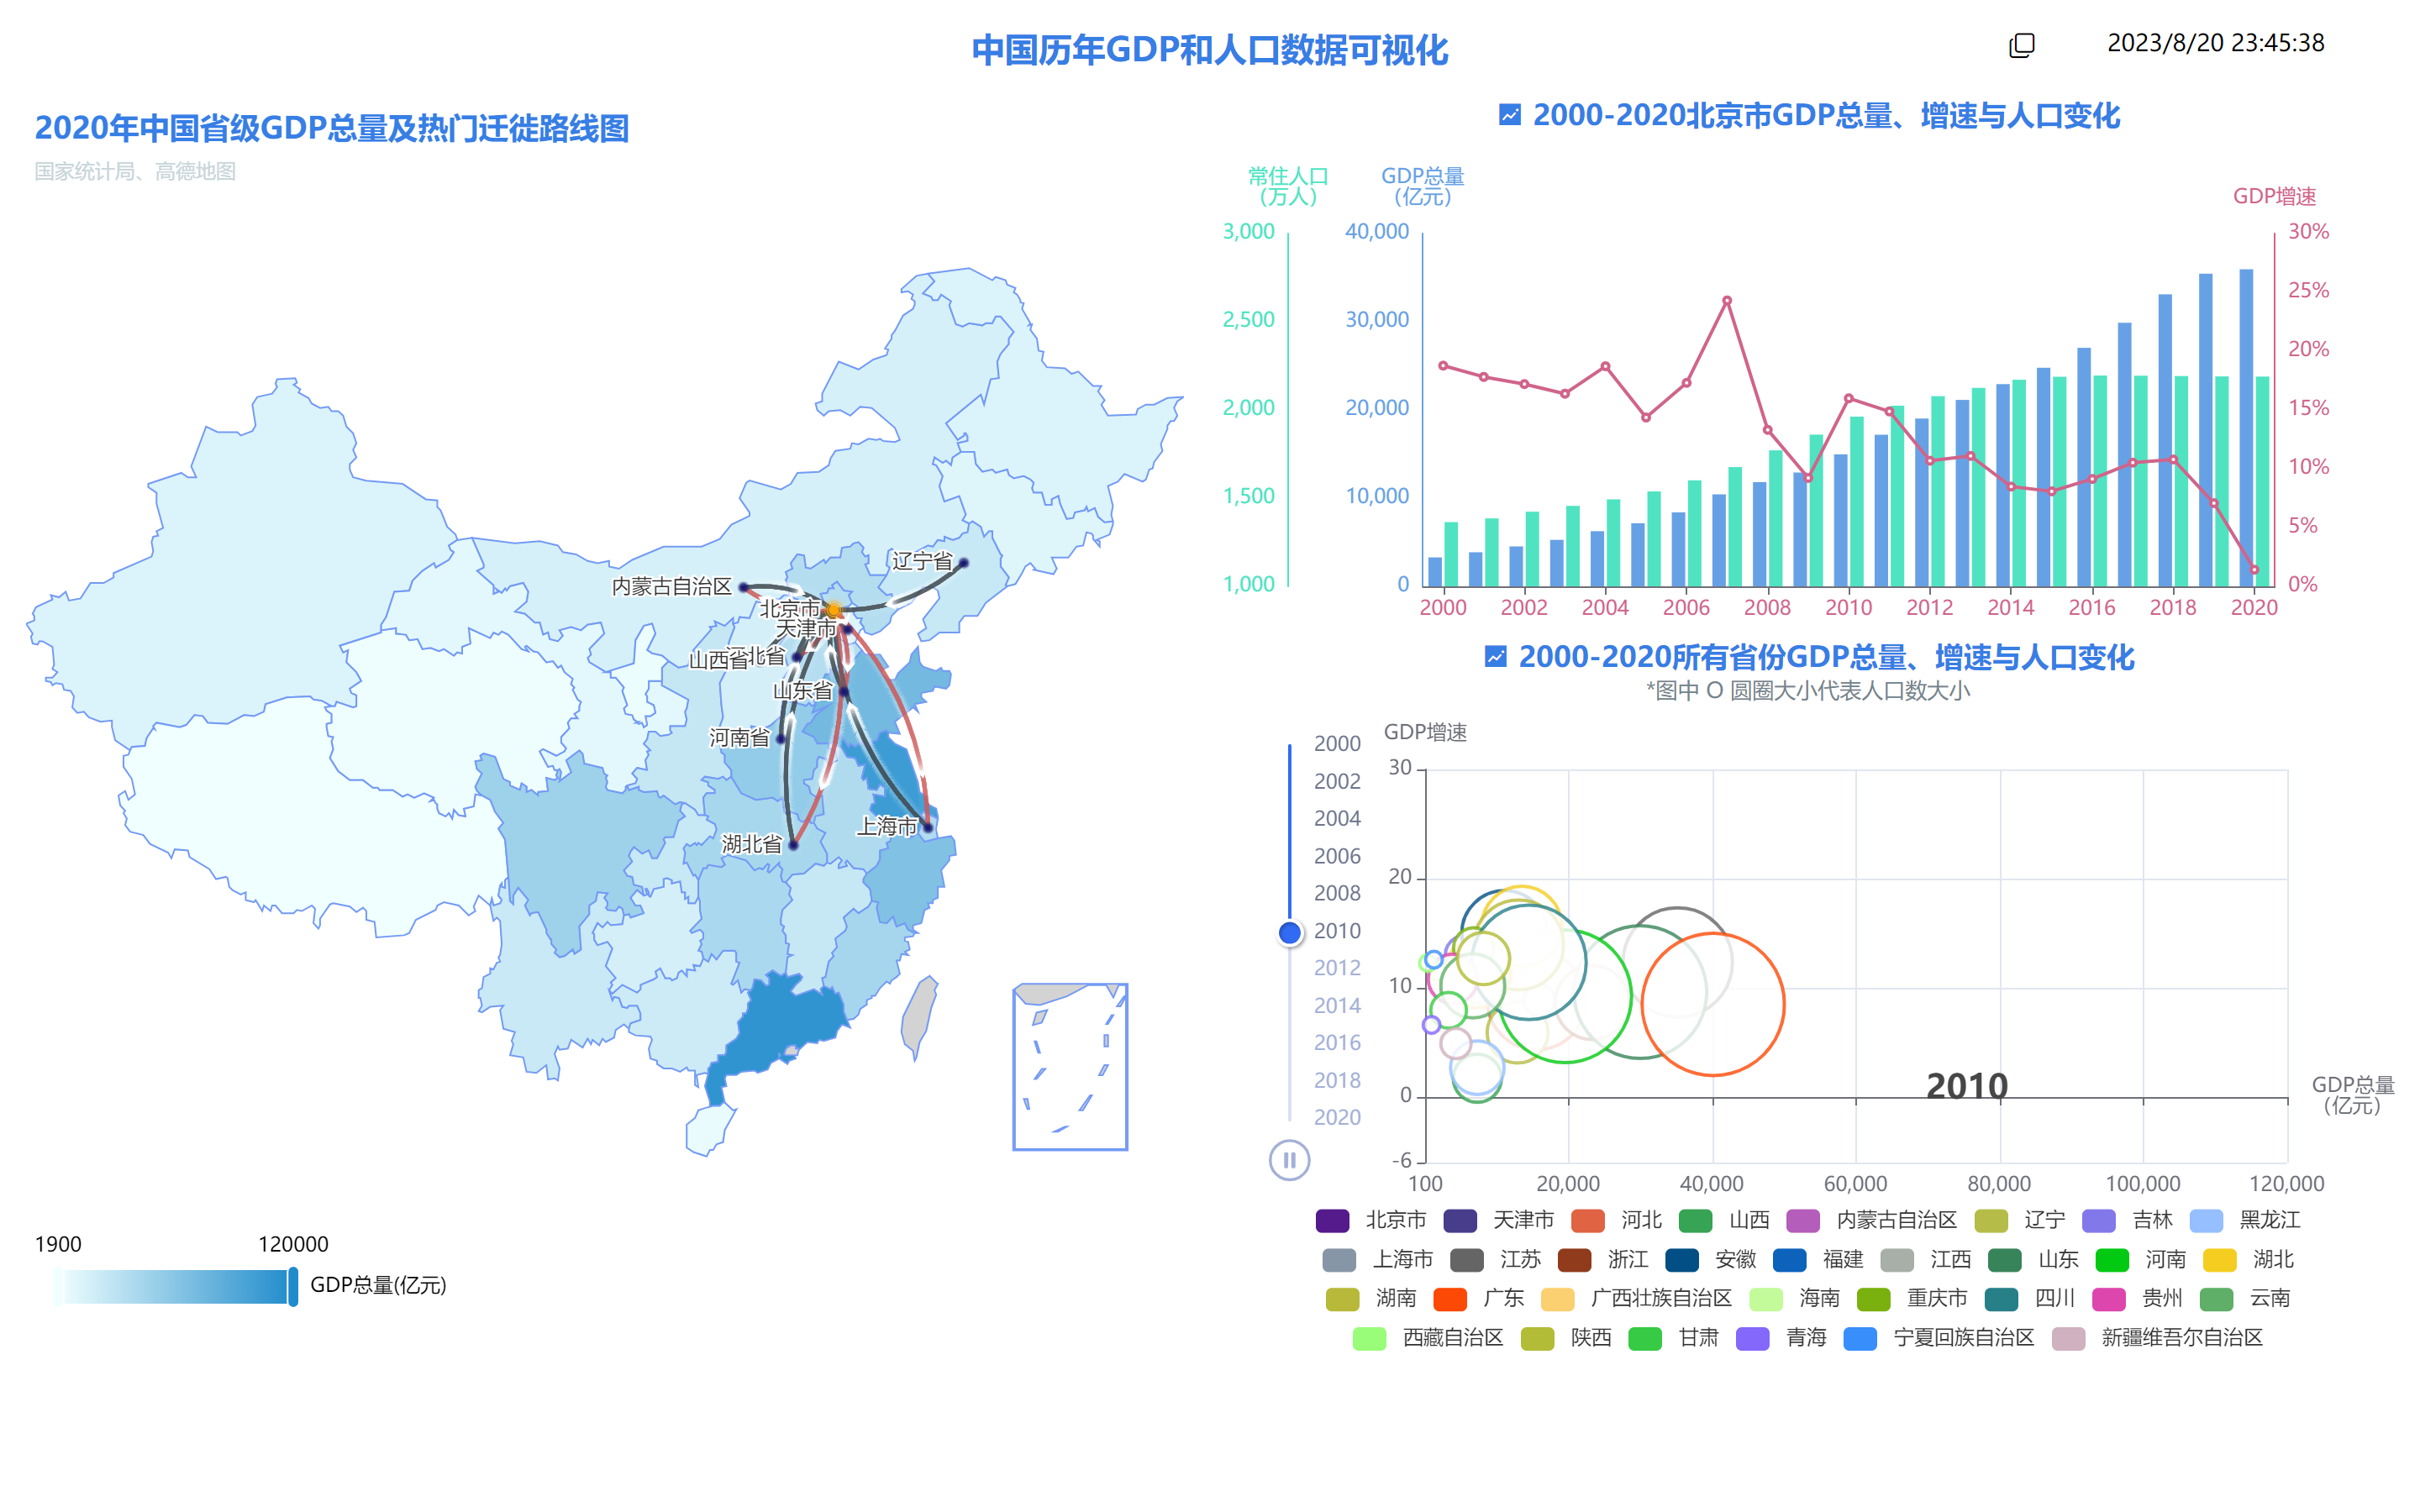
Project Screenshot
-
Demo Link https://lianshiwei.github.io/datavisualization.github.io/#/
Thanks to @adelamingyi, @lianshiwei and @AnnoChen for their contributions to the project!