(These instructions assume that you've already got local_pathfinding set up withing the src directory of a catkin workspace. Also, the catkin_make and source commands have been omitted.)
- Install OpenCPN
$ sudo apt install software-properties-common
$ sudo add-apt-repository ppa:opencpn/opencpn
$ sudo apt update
$ sudo apt install opencpn- Configure OpenCPN to listen to UDP port
localhost:65500
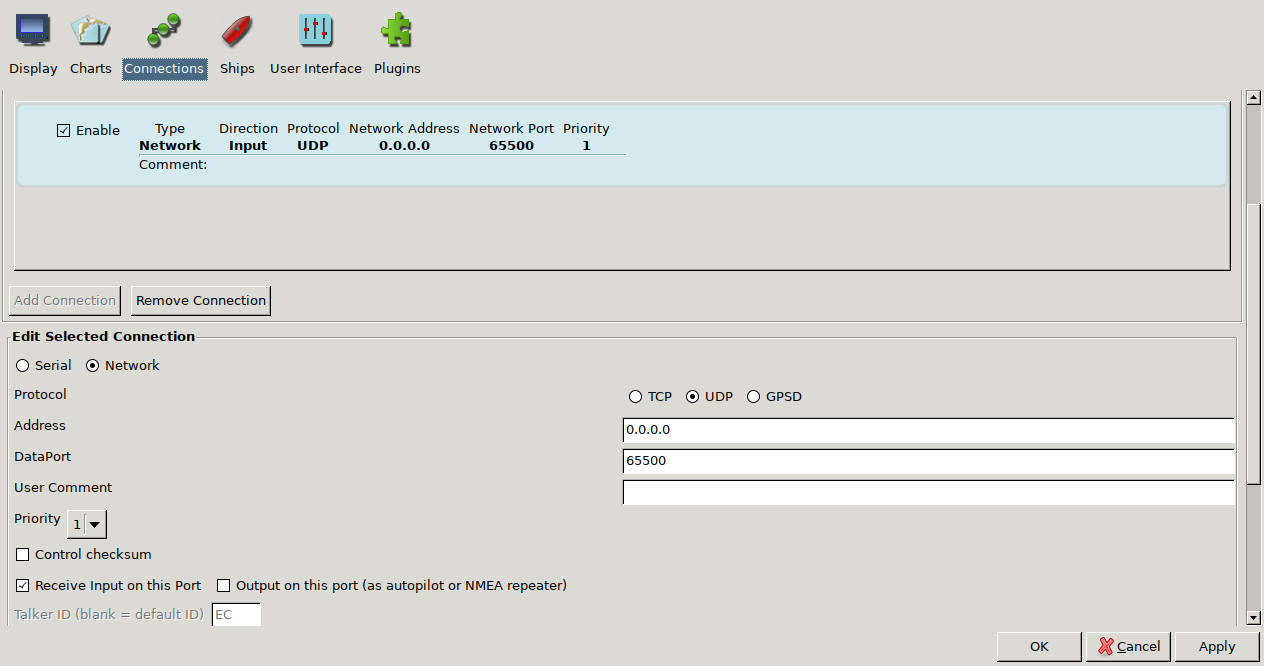
Under connections, add a new UDP connection at 0.0.0.0:65500. Make sure to check Receive Input on this Port.
Click OK and close the Options window. You can (but shouldn't have to) confirm that OpenCPN is listening by using netstat from the net-tools package:
$ sudo netstat -lp | grep opencpn
udp 0 0 0.0.0.0:65500 0.0.0.0:* 14613/opencpn - Run the mock ROS nodes
Run the following commands in (preferably in separate terminals, or use
screenortmux)
$ roscore
$ rosrun local_pathfinding MOCK_AIS.py
$ rosrun local_pathfinding MOCK_controller_and_boat.py
$ rosrun local_pathfinding MOCK_UDP_bridge.py-
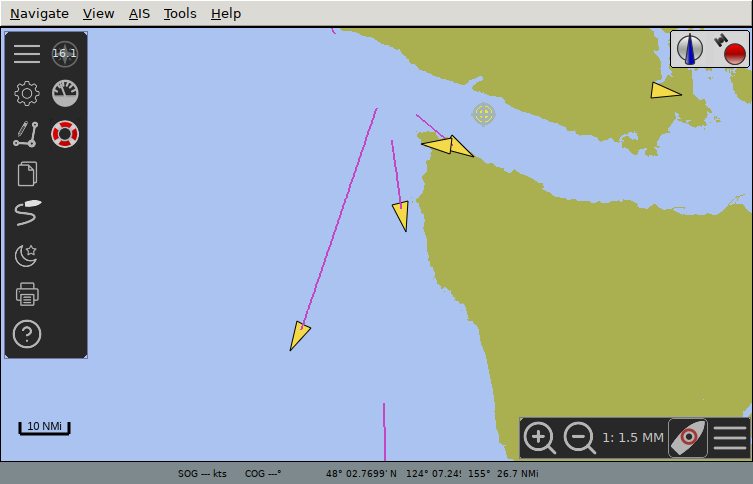
Launch OpenCPN The boats should now be visible in the OpenCPN map. The yellow arrows are AIS units.
-
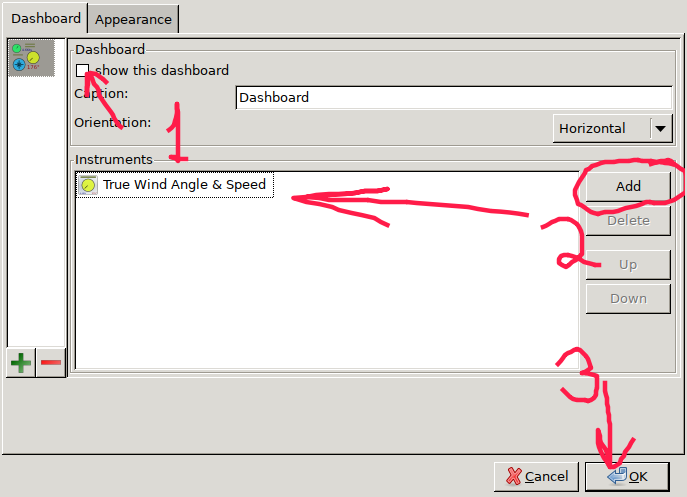
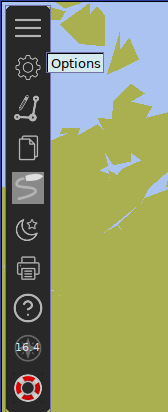
BONUS: Configure OpenCPN to show wind direction and speed Open the Options window again, open the Plugins tab. Enable the Dashboard plugin, and hit Preferences.
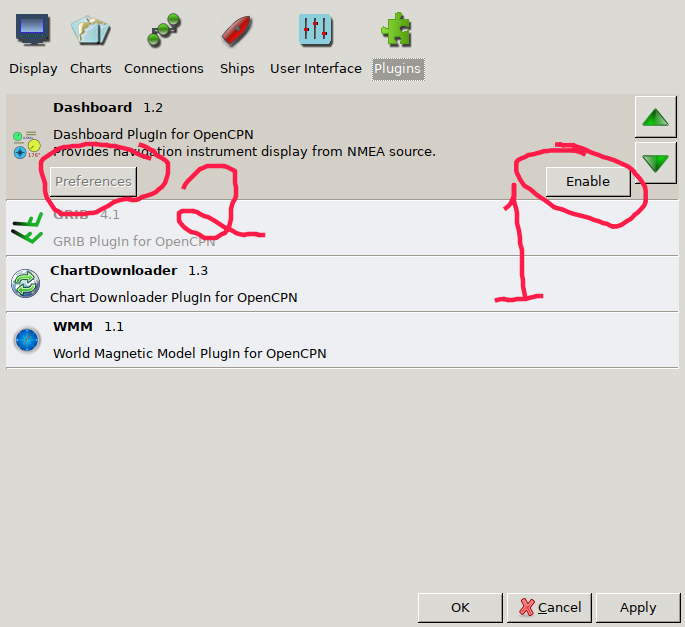
Enable Show this dashboard, and add the True Wind Angle and Speed instrument. Remove the others. Hit OK, and finally hit OK again to close the Options window.
