CLOTHO is a testing framework for detecting serializability violations in (SQL) database-backed Java applications executing on weakly-consistent storage systems. It combines a static analyzer and model checker to generate abstract executions, discover serializability violations in these executions, and translate them back into concrete test inputs suitable for deployment in a test environment. CLOTHO currently supports Apache Cassandra as its database module. We are planning to add support for other databases in the future.
Create a local repo of the project:
git clone https://github.com/Kiarahmani/CLOTHO.gitMake sure docker daemon is running and current user is added to docker group and has privileges (read more).
Move to the project directory and run the following command to create a cluster of 2 Cassandra nodes each running in a docker container:
./clotho.sh --setup 2You can verify that the cluster is correctly set up by running:
./clotho.sh --clusterYou should see something like:
Datacenter: DC1
===============
Status=Up/Down
|/ State=Normal/Leaving/Joining/Moving
--  Address     Load       Tokens       Owns (effective)  Host ID                               Rack
UN  172.17.0.2  325.94 KiB  256          100.0%            2b1a9362-9071-4976-8434-315667548f3e  RAC1
Datacenter: DC2
===============
Status=Up/Down
|/ State=Normal/Leaving/Joining/Moving
--  Address     Load       Tokens       Owns (effective)  Host ID                               Rack
UN  172.17.0.3  309.56 KiB  256          100.0%            d3780a0e-7ebc-4d8a-a7e8-60ba9a74bdf9  RAC2
Now that the cluster is up and running, you should choose a <benchmark_name> from pre-defined examples {dirty_read, dirty_write, long_fork, write_skew, lost_update} (or as we explain later, implement your own in analyzer/src/benchmarks/).
The following command will compile the source codes, including the chosen benchmark under test:
make benchmark=<benchmark_name>Now you can run CLOTHO's static analyzer by the following command (you can optionlly configure the analysis by editing templates/config.properties).
./clotho.sh --analyze <benchmark_name>Once the analysis finishes, CLOTHO will report the number of static anomalies found in <benchmark_name>, for example:
     [java] ================================
     [java] === AR compile time:  256ms
     [java] === Anomalies found:  1
     [java] === Analysis time:	  1753 ms
     [java] === Avg Ext. Time:	  1753 ms
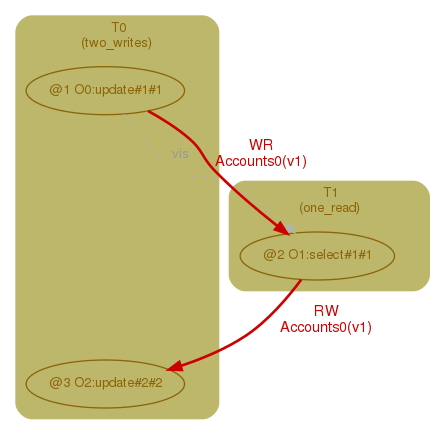
Now you can view anomaly <anomaly_number> by running:
./clotho.sh --show <benchmark_name> <anomaly_number>For example:
Following command will create required keyspace and schema for an anomaly on the Cassandra cluster:
./clotho.sh --init <benchmark_name> <anomaly_number>Now open separate terminals: one for the test controller and one for each transaction (a.k.a client) involned in the anomaly.
Run the following command in the controller terminal:
./clotho.sh -d <benchmark_name> <anomaly_number>Finally, run the following command in each client terminal:
./clotho.sh --client <benchmark_name> <anomaly_number> <client_number>You should see each client running according to the buggy schedule determined in the static analysis step. Have fun!
- CLOTHO: Directed Test Generation for Weakly Consistent Database Systems (Conditionally Accepted to OOPSLA'19)
Copyright (c) 2019 Kia Rahmani

