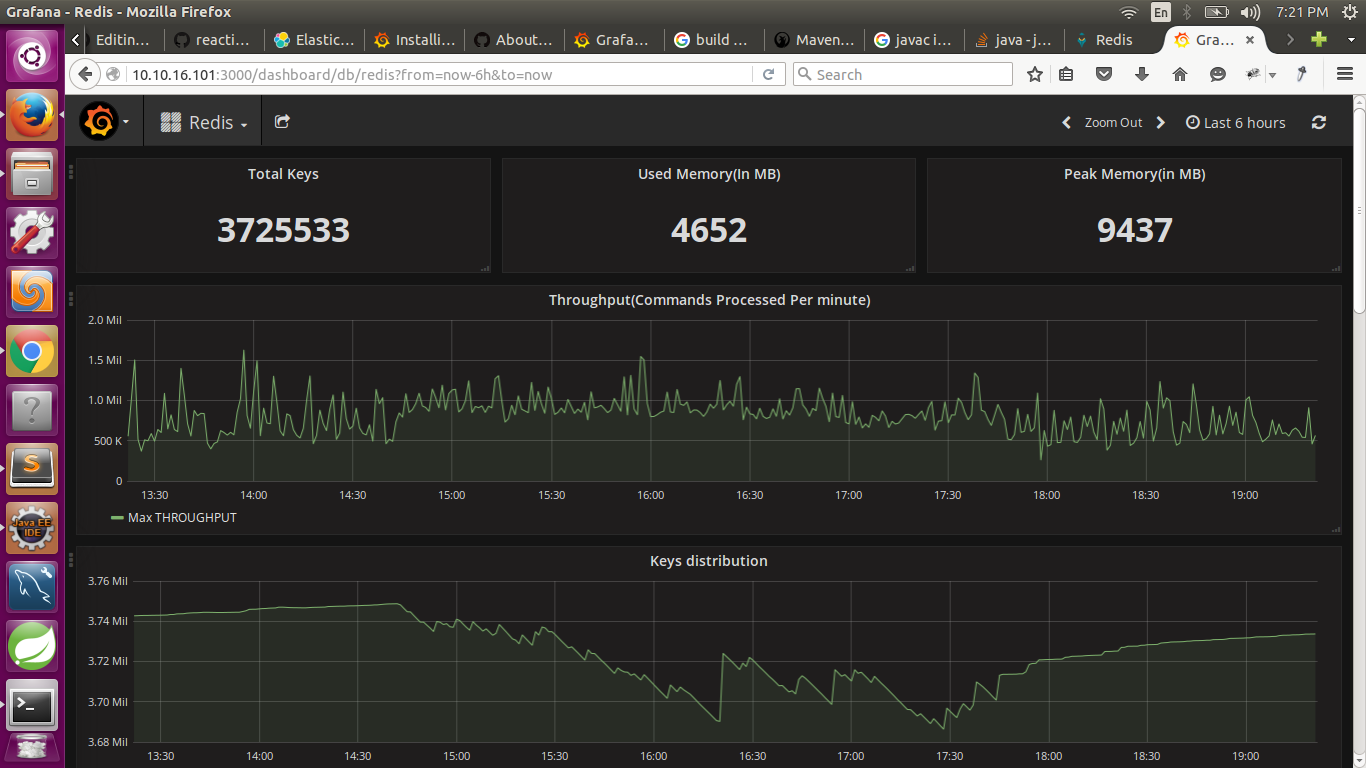
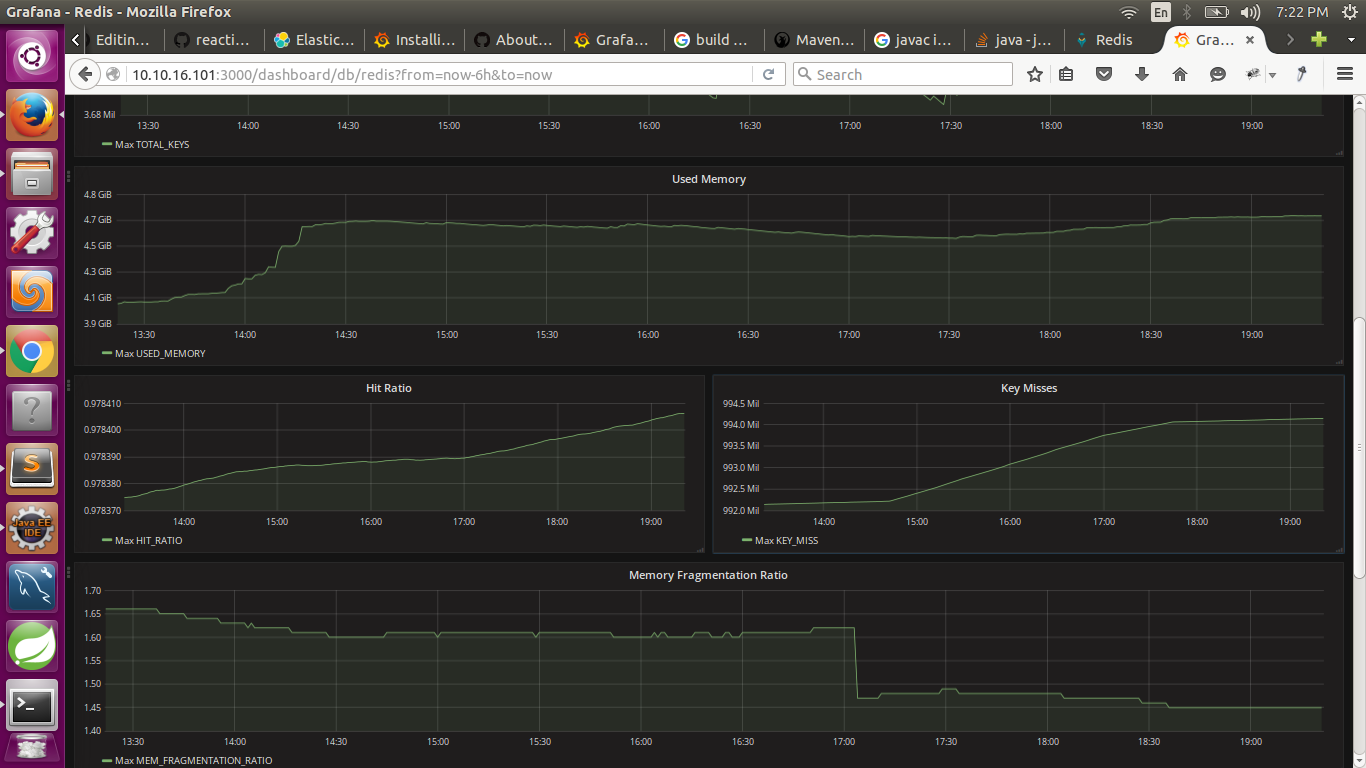
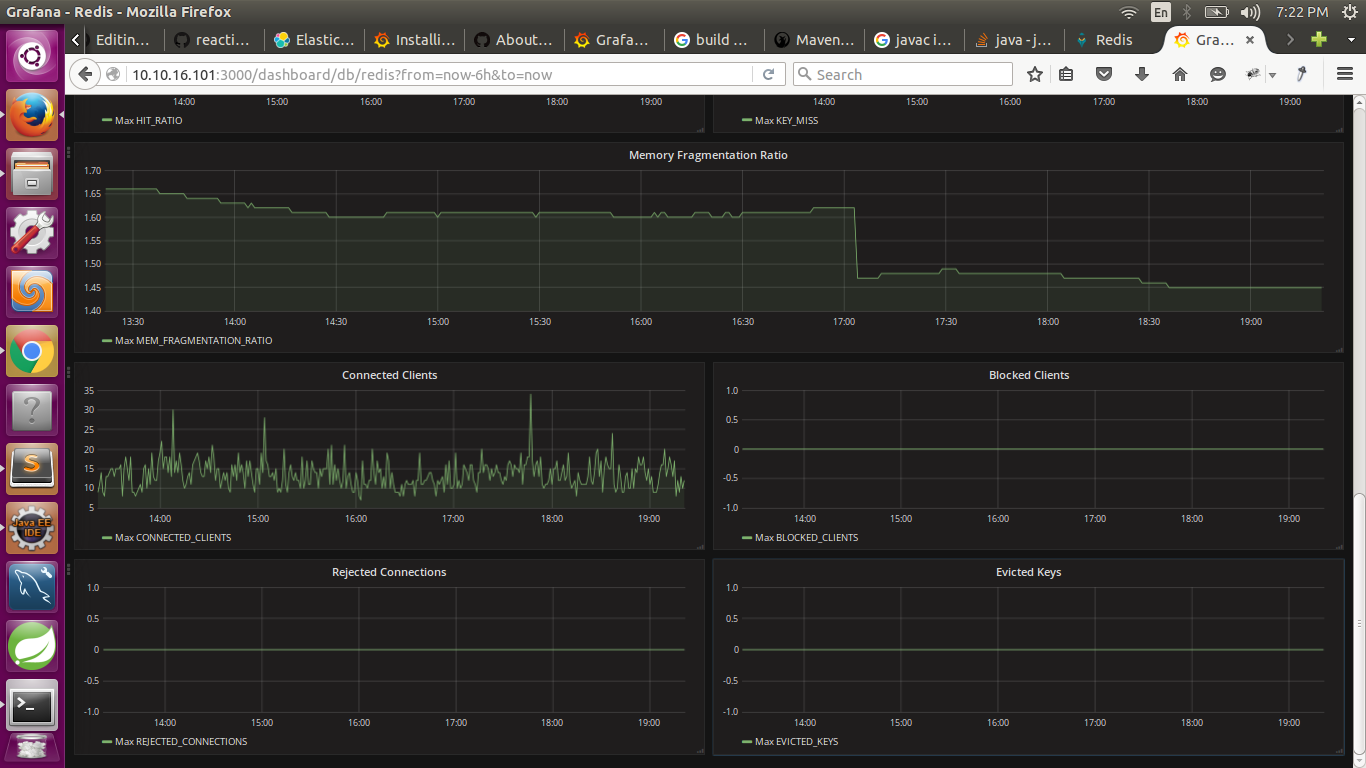
Happy Redis is the monitoring tool to monitor the redis metrices.
a) ElasticSearch (To Store the Data) - Download
b) Grafana Server (To Plot the Data) - Download
Note : I have used 2.3.4 as elasticsearch & latest Grafana (4.2.0)
Once Both are downloaded & installed, some configuration is needed for both :
a) Elasticsearch : schema.txt file contains the schema needed to be added. Just copy the contents of file, change the elasticSearch IP(localhost), PORT(9200), Index Name(redis_monitoring) & run the command using terminal. It should create the schema.
b) Grafana : Once elasticsearch is running & schema is created, we need to add this to Grafana. Open Grafana web interface, Go the DataSource Page, click on Add Data Source. Fill the form, Type (Choose ElasticSearch), URL(will be your elasticSearch URL), Index Name(redis_monitoring [if you dint change it]), Date time field is DATETIME (this is the timestamp field in schema), version is your elasticsearch version, access type(proxy).
Once Datasource is added, A sample dashboard is attached(Redis.json), which can be imported & this will create all the graphs. To import, go to Dashboard --> Import , Select the File(Redis.json), select the Data Source created. The Dashboard is created.
c) Java Code :
To track the metric, java code hits the Redis every minute, fetch the metrices & store them in elasticsearch. Code is present in happyRedis folder(JAVA MAVEN PROJECT). To use it, download the happyRedis folder.
Before using it, in the file com.happyRedis.Constants, change the Redis Host, Redis Port, ElasticSearch URL.
Go to the folder directory, run the following command.
mvn clean install
This will build the code & create the jar file inside target folder(Use the one with-dependencies.jar)
Run the JAR File will start Collecting & Storing Redis Data To Elastic Search & Grafana will plot it. Note : JAVA_HOME variable must be point to JAVA 8 or change the pom.xml file according to Java version