Population choropleth map tutorial #821
There are no files selected for viewing
| Original file line number | Diff line number | Diff line change |
|---|---|---|
| @@ -0,0 +1,312 @@ | ||
| --- | ||
| title: Population Choropleth Map | ||
| description: This tutorial demonstrates how to create a population choropleth map, leveraging the Gridded Population of the World dataset and interactive widgets for user interaction. | ||
| author: pinkychow1010 | ||
| tags: remote sensing, population, gwp, socioeconomic data, risk assessment | ||
| date_published: 2024-05-05 | ||
| --- | ||
|
|
||
| <!-- | ||
| Copyright 2019 The Google Earth Engine Community Authors | ||
|
|
||
|
|
||
| Licensed under the Apache License, Version 2.0 (the "License"); | ||
| you may not use this file except in compliance with the License. | ||
| You may obtain a copy of the License at | ||
|
|
||
| http://www.apache.org/licenses/LICENSE-2.0 | ||
|
|
||
| Unless required by applicable law or agreed to in writing, software | ||
| distributed under the License is distributed on an "AS IS" BASIS, | ||
| WITHOUT WARRANTIES OR CONDITIONS OF ANY KIND, either express or implied. | ||
| See the License for the specific language governing permissions and | ||
| limitations under the License. | ||
| --> | ||
|
|
||
| ## Context | ||
|
|
||
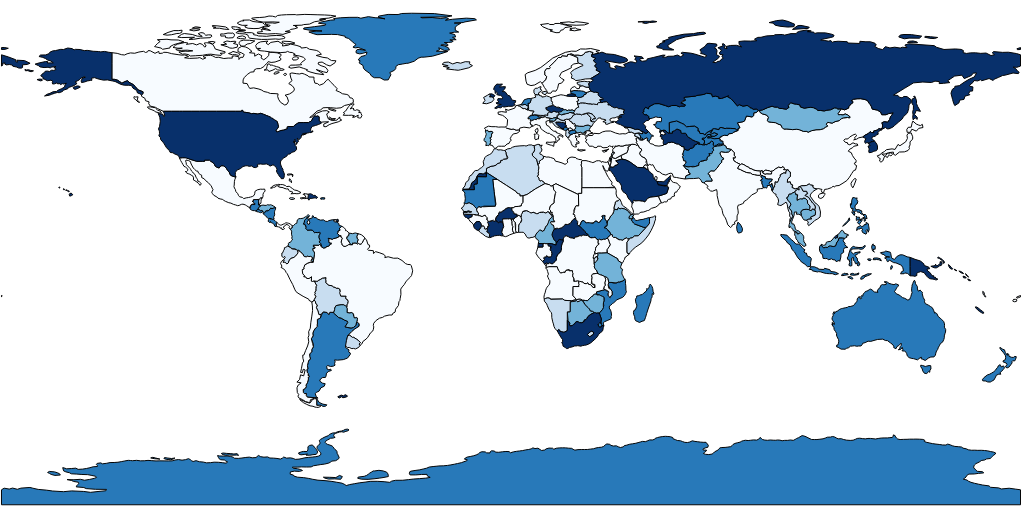
| Understanding social demographics is crucial for assessing the interactions between natural processes and human activities, such as in hazard risk assessment. A choropleth map is a statistical thematic map that uses colors corresponding to an aggregate summary of a geographic characteristic. It's a visually effective approach to convey a large amount of information within political administrative units. | ||
|
|
||
| This tutorial demonstrates the creation of such maps using the [Gridded Population of the World (GPW)](https://sedac.ciesin.columbia.edu/data/collection/gpw-v4) collection for 2020, which models the distribution of population on a continuous global surface with 30 arc-second (approximately 1km) grid cells. It also showcases the creation of an interactive tool to retrieve values of polygons by clicking on the map, which can be useful in an app application. | ||
|
There was a problem hiding this comment. Suggest to rephrase "app application" as "interactive app" |
||
|
|
||
| The general workflow is as follows: | ||
|
|
||
| 1. Define the study site (Thailand) for analysis. | ||
| 2. Compute zonal statistics from population data. | ||
| 3. Create a choropleth map from zonal statistics. | ||
| 4. Apply functions to display the choropleth map. | ||
| 5. Add an interactive inspector widget to retrieve population density from map clicks. | ||
|
|
||
| <br> | ||
|
|
||
|  | ||
|
There was a problem hiding this comment. The image will need to be uploaded into the tutorial folder and then use a relative path to define it (just the image file name with extension, like you used at the end of the tutorial) |
||
|
|
||
| Conceptual figures sourced from [GISGeography](https://gisgeography.com/wp-content/uploads/2016/08/Featured-Choropleth-Map.png) | ||
|
|
||
| <br> | ||
|
|
||
| ## (1) Defining Study Site | ||
|
|
||
| To create a choropleth map, we need polygon layers defining the region boundary. | ||
| In this tutorial, we'll work with administrative level 1 polygons for Thailand from the geoBoundaries Global Database of | ||
|
There was a problem hiding this comment. Can you hyperlink to geoBoundaries catalog entry (https://developers.google.com/earth-engine/datasets/catalog/WM_geoLab_geoBoundaries_600_ADM1) |
||
| Political Administrative Boundaries (Runfola et al., 2020). Users can adjust the study country by altering the | ||
| country code. | ||
|
|
||
| The admin1 FeatureCollection comprises administrative units of various countries, grouped and identified by several properties. | ||
| For instance, consider the example below: | ||
|
|
||
| * shapeGroup: THA | ||
| * shapeID: THA-ADM1-1590546715-B4 | ||
| * shapeISO: TH-39 | ||
| * shapeName: Nong Bua Lam Phu Province | ||
| * shapeType: ADM1 | ||
|
|
||
| To filter only the provinces in Thailand, we need to retrieve all features with a shapeGroup corresponding to "THA". | ||
| You can find the corresponding alpha-3 code for Thailand at [this link](https://www.iban.com/country-codes). Afterward, we'll center the basemap on our study country. | ||
|
|
||
| ```javascript | ||
| // Load administrative boundaries for Thailand | ||
| var admin1 = ee.FeatureCollection("projects/sat-io/open-datasets/geoboundaries/HPSCGS-ADM1"); | ||
| var geometry = admin1.filter(ee.Filter.eq('shapeGroup', 'THA')); | ||
|
|
||
| // Center the map on Thailand | ||
| Map.centerObject(geometry, 6); | ||
|
|
||
| // Set map display with satellite background | ||
| Map.setOptions('HYBRID'); | ||
| ``` | ||
|
|
||
| ## (2) Zonal statistics of population density | ||
|
There was a problem hiding this comment. Please use consistent case for section titles - I think sentence case like this is preferred. |
||
|
|
||
| Zonal statistics summarize the properties of raster datasets within specified zones or regions. | ||
| In this application, we'll compute population density from the GPW gridded data and summarize it for each province. | ||
|
There was a problem hiding this comment. Can you hyperlink to the data catalog entry for the GPW gridded data (https://developers.google.com/earth-engine/datasets/catalog/CIESIN_GPWv411_GPW_Population_Count) |
||
| The corresponding value will be stored in a property called 'pop_per_km' for each polygon. | ||
| We'll first create a function for computing zonal statistics to organize the workflow. | ||
|
|
||
| ```javascript | ||
| // Function to compute zonal population density | ||
| function zonal_pop_density(geometry) { | ||
|
|
||
| // Load GPW dataset: data source for population count | ||
| var dataset = ee.ImageCollection("CIESIN/GPWv411/GPW_Population_Count") | ||
| .limit(1, 'system:time_start', false) // reverse sort | ||
| .first(); // data available for several years, the latest image corresponds to 2020 | ||
| var pop = dataset.select('population_count').clip(geometry); // get image for Thailand only | ||
|
|
||
| // Apply moving window: to sum up population count for each grid of 1 km2, | ||
| // we need to create a kernel covering the grid size | ||
| // Define a kernel to convert count to population per km square | ||
| var kernelSize = ee.Kernel.square({ | ||
| radius: 1000, // square length equals 1000 m to cover 1 square kilometer | ||
| units: 'meters', | ||
| normalize: true | ||
| }); | ||
|
|
||
| // Compute density: Summing up the population counts within the kernel | ||
| var pop_density = pop.reduceNeighborhood({ | ||
|
There was a problem hiding this comment. I think you can achieve the calculation of var pop_density = pop.reduceResolution(ee.Reducer.sum())
.reproject(pop.projection().atScale(1000))It is using a weighted sum reducer with a 1000 meter window. |
||
| reducer: ee.Reducer.sum(), | ||
| kernel: kernelSize | ||
| }); | ||
|
|
||
| // Zonal statistics: Reduce population density to administrative units and compute mean | ||
| var zonal_stats = pop_density.reduceRegions({ | ||
| collection: geometry, // reduce it to the admin 1 boundaries | ||
| reducer: ee.Reducer.mean().setOutputs(['pop_per_km']) // output named as pop_per_km | ||
| }); | ||
|
|
||
| // Return outputs | ||
| return zonal_stats; | ||
| } | ||
| ``` | ||
|
|
||
| ## (3) Creating a choropleth map | ||
|
|
||
| After computing zonal statistics, with individual values computed for each polygon, | ||
| we'll create a choropleth map, which is essentially a polygon map colored based on its values in the predefined scale. | ||
| To do so, we'll set up the color scale, compute colors to be displayed for each province, then use these colors for the map. | ||
|
|
||
| ```javascript | ||
| // Function to create a choropleth map | ||
| function choropleth_map( | ||
| vector, // admin 1 features | ||
| attribute, // 'pop_per_km' | ||
| palette, // color scale | ||
| title // output layer name | ||
| ) { | ||
|
|
||
| // Convert palette to a list | ||
| var colors = ee.List(palette); | ||
| // Convert admin 1 polygons to a FeatureCollection | ||
| var zone = ee.FeatureCollection(vector); | ||
|
|
||
| // Compute minimum and maximum attribute values (population density) | ||
| var min_val = ee.Number(vector.aggregate_min(attribute).getInfo()); | ||
| var max_val = ee.Number(vector.aggregate_max(attribute).getInfo()); | ||
|
|
||
| // Get index in logarithmic scale | ||
| // To enhance visuals, we use a logarithmic scale interpolation instead of linear interpolation | ||
| // We'll define a function to perform this task. | ||
|
|
||
| // Function to get the index of a value based on a logarithmic scale | ||
| var get_index = function(value) { | ||
| var class_n = palette.length; // number of classes in the choropleth map | ||
|
|
||
| // Calculate logarithms of min and max | ||
| var log_min = min_val.log(); | ||
| var log_max = max_val.log(); | ||
|
|
||
| // Calculate logarithmic step | ||
| var log_step = (log_max.subtract(log_min)).divide(class_n); | ||
|
|
||
| // Calculate logarithm of the input value | ||
| var log_value = value.log(); | ||
|
|
||
| // Calculate the index in integers based on the logarithmic scale | ||
| var index = (log_value.subtract(log_min)).divide(log_step).round(); | ||
|
|
||
| // Clamp the index within the range | ||
| var index_clamp = index.clamp(0, ee.Number(class_n).subtract(1)); | ||
|
|
||
| return index_clamp; | ||
| }; | ||
|
|
||
| // Apply the get_index function to each feature in the FeatureCollection | ||
| zone = zone.map(function(f) { | ||
| var value = f.getNumber(attribute); // get polygon value | ||
| var index = get_index(value); // get index to retrieve color | ||
|
|
||
| var color = colors.get(index); // retrieve corresponding color for the map | ||
| return f.set('style', {fillColor: color}); // use color to fill the polygons | ||
| }); | ||
|
|
||
| // Style the FeatureCollection based on the computed colors | ||
| var VisCustom = zone.style({ | ||
| styleProperty: 'style' | ||
| }); | ||
|
|
||
| // Add the styled FeatureCollection to the map | ||
| Map.addLayer(VisCustom, {}, title); | ||
|
|
||
| // Define visualization parameters | ||
| var vis = { | ||
|
There was a problem hiding this comment. I think the |
||
| min: vector.aggregate_min(attribute).getInfo(), | ||
| max: vector.aggregate_max(attribute).getInfo(), | ||
| palette: palette | ||
| }; | ||
|
|
||
| } | ||
| ``` | ||
|
|
||
| ## (4) Apply Functions | ||
|
|
||
| With functions for both computing zonal statistics and displaying the choropleth map, | ||
| we can apply the functions with our data. | ||
|
|
||
| ```javascript | ||
| // Define parameters | ||
|
|
||
| // Coolwarm color map with 7 classes | ||
| var palette = ['#3B4CC0', '#6F91F2', '#A9C5FC', '#DDDDDD', '#F6B69B', '#E6745B', '#B40426']; | ||
| var title = "Population Density"; // name of the output layer | ||
|
|
||
| // Compute zonal statistics | ||
| var pop_density = zonal_pop_density(geometry); | ||
|
|
||
| // Add a choropleth map using computed statistics | ||
| var attribute = "pop_per_km"; | ||
|
|
||
| choropleth_map( | ||
| pop_density, | ||
| attribute, | ||
| palette, | ||
| title | ||
| ); | ||
|
|
||
| ``` | ||
|
|
||
| <br> | ||
|
|
||
| ## (5) Interactive Inspector Widgets | ||
|
|
||
| We have our map displayed. Now, let's add an interactive widget that allows users to click on map polygons to display values in a small panel. | ||
|
|
||
| ```javascript | ||
| // Add a panel to the map with an initial message | ||
| var inspector = ui.Panel([ui.Label('Click on the district')]); | ||
| Map.add(inspector); | ||
|
|
||
| // Listen for map clicks | ||
| Map.onClick(function(coords) { | ||
| // Show loading label | ||
| inspector.widgets().set(0, ui.Label({ | ||
| value: 'Loading...', | ||
| style: {color: 'gray'} | ||
| })); | ||
|
|
||
| // Create a point geometry from the clicked location | ||
| var click_point = ee.Geometry.Point(coords.lon, coords.lat); | ||
|
|
||
| // Extract district names and population densities for the clicked location | ||
| var district = pop_density.reduceColumns(ee.Reducer.toList(), ['shapeName']).get('list'); | ||
| var density_feature = pop_density.reduceColumns(ee.Reducer.toList(), ['pop_per_km']).get('list'); | ||
|
|
||
| // Convert the full district list to a FeatureCollection | ||
| var district_list = pop_density.toList(pop_density.size()); | ||
|
|
||
| // Find the index of the clicked district | ||
| var retIdx = district_list.map(function(element) { // check for each polygon if it contains the point | ||
| var idx = district_list.indexOf(element); | ||
| return ee.Algorithms.If(ee.Feature(element).contains(click_point), idx, 0); // get index | ||
| }).removeAll([0]); // remove irrelevant checks | ||
|
|
||
| // Initialize variables | ||
| var name = ""; | ||
| var density = "NA"; | ||
|
|
||
| // Check if a district is found at the clicked location | ||
| if (retIdx.size().getInfo() > 0) { | ||
| // Extract district name and density | ||
| // Get the district name from the 'district' list using 'retIdx' | ||
| name = ee.List(district) // Access the list of districts from geoBoundaries | ||
| .get(retIdx.get(0).getInfo()) // Get name element | ||
| .getInfo(); // JavaScript object | ||
|
|
||
| // Get the population density | ||
| density = ee.List(density_feature) // Access the 'density_feature' list | ||
| .get(retIdx.get(0).getInfo()) // Get element | ||
| .getInfo() // JavaScript object | ||
| .toFixed(0); // Round value to an integer | ||
| } | ||
|
|
||
| // Display district name and population density | ||
| inspector.widgets().set(0, ui.Label({ | ||
| value: "Population density in " + name + ": " + density + "/ km2" | ||
| })); | ||
|
|
||
| }); | ||
|
|
||
| ``` | ||
|
|
||
|  | ||
|
|
||
| In this tutorial, we successfully create a choropleth map using available population data. | ||
| Users can adjust parameters such as color map, data layers, and study regions to explore different insights from diverse datasets. | ||
|
|
||
| <br> | ||
|
|
||
| ## Acknowledgements | ||
|
|
||
| Ka Hei Chow devised this tutorial. | ||
|
|
||
| <br> | ||
|
|
||
| ## References | ||
|
|
||
| Center for International Earth Science Information Network - CIESIN - Columbia University. 2018. | ||
| Gridded Population of the World, Version 4 (GPWv4): Population Count, Revision 11. Palisades, NY: | ||
| NASA Socioeconomic Data and Applications Center (SEDAC). https://doi.org/10.7927/H4JW8BX5. | ||
| Accessed DAY MONTH YEAR. | ||
|
|
||
| Runfola D, Anderson A, Baier H, Crittenden M, Dowker E, Fuhrig S, et al. (2020) | ||
| geoBoundaries: A global database of political administrative boundaries. PLoS ONE 15(4): | ||
| e0231866. https://doi.org/10.1371/journal.pone.0231866 | ||
| ``` | ||
There was a problem hiding this comment.
Choose a reason for hiding this comment
The reason will be displayed to describe this comment to others. Learn more.
tags cannot have spaces - you'll need to add hyphens for "remote sensing" and "risk assessment"