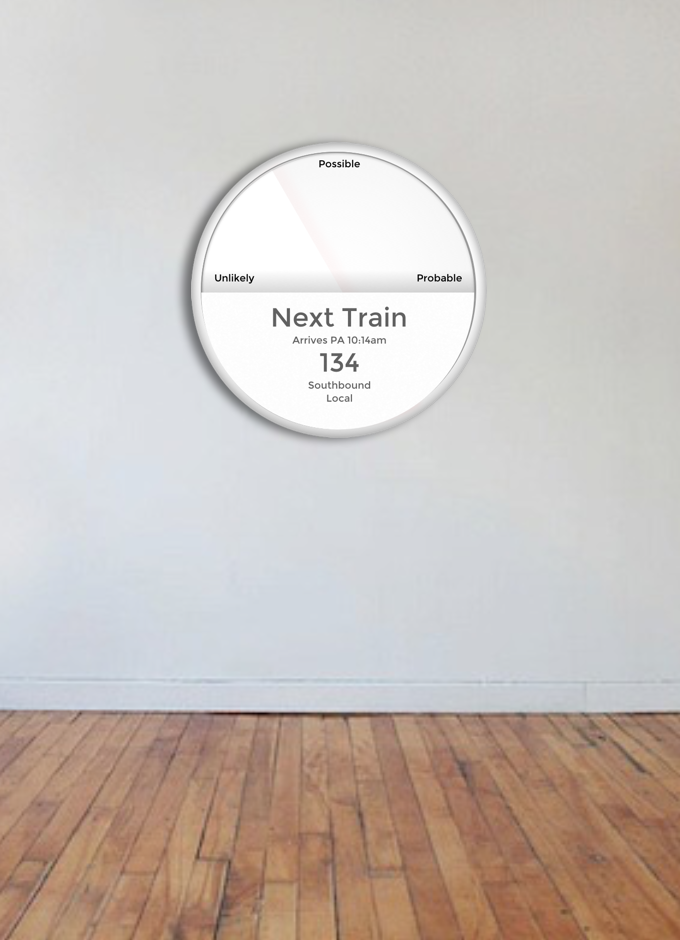
This project is an attempt to analyze twitter (and other) datas to understand whether I can detect disruption within the Caltrain system, and map (with some degree of accuracy) the probability that something will go wrong.
- 00getdata - Download and transform twitter data
- 01sepEvents - Separate tweets into unique events
- 03explore - Initial poking around
- 03merge_hand_truth - Merge in hand truth data, truth_tweets.csv
- 04fill_in_positives - Take all_stops_in_pa.csv and transform into positives data set
- 05merge_with_positives - Merge in positives set
- 06initial_analysis - Sketchpad for early interprtetive models
- 07focus_decision_tree - Complete analysis: Decision trees and gradient boosting, as well as multiple predictive approaches and tuning.
