The People Visualization
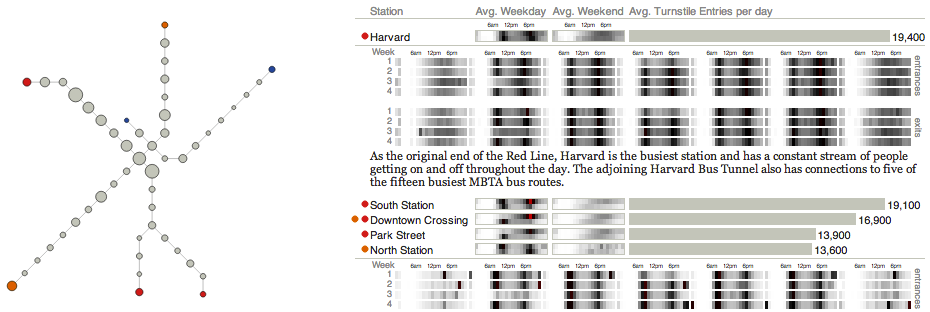
This section from Visualizing MBTA Data displays turnstile data for the month
of February in a table and on a map glyph. You can click on each row in the
table to expand out a detailed heatmap for that stop over the month. To
reinforce the connection between the rank of a stop and its physical location,
hovering over a stop highlights its location on the map and vice-versa.
the-people.js is responsible for rendering the all-station turnstile data for
the month, the map glyph, the bar chart with embedded heatmaps, and setting up
interaction with surrounding text.
http://mbtaviz.github.io/#people
This visualization requires 4 data files to render:
-
station-network.jsonnodes (stations) and links that represent the network topology of the subway system -
spider.jsonscreen placement for stations in order to render the map glyph -
turnstile-gtfs-mapping.jsonmapping between GTFS station IDs and station IDs used in the turnstile data -
turnstile-heatmap.json.jsonper-hour turnstile entry/exit count data for each station and the overall system
station-network.json and spider.json are described in
[Common Data Files](Common Data Files).
Contains a mapping from station ID in the turnstile data to GTFS ID of the station
{
  "turnstile data name for station": "GTFS ID of the station", other stations...
}
This file is broken up into several different sections. There are also
convenience values that are pre-computed to reduce the amount of processing in
the browser. At the (logical) top of the file is min, mean, and max values for
all stops. This is used to create the relative scales for coloring the
heatmaps. Next it contains the aggregate values for all stops in the all
object and then the same data for each individual stop in the stops array.
Each index in the stops array contains all of the information to draw the
heatmap for a stop. The times array contains the entrances and exit values
for each time of the day. Each object represents one value in the heatmap.
The entrancesByType values are used in the bar charts and the
averagesByType values are used for the smaller heatmaps next to each stop.
{
  "min": minimum entrances per-hour for a station,
  "mean": average entrances per-hour per-station,
  "max": max entrances per-hour for a station,
  "all": {
    "min": minimum entrances per-hour across all stations,
    "mean": average entrances per-hour across all stations,
    "max": max entrances per-hour across all stations,
    "entrancesByType": {
      "offpeak": total number of entrances on a typical weekend/holiday,
      "weekday": total number of entrances on a typical weekday,
      "all": total number of entrances on a typical day
    }
    "times": [
      {
        "time": unix timestamp in milliseconds,
        "hour": hour of day,
        "day": day of week,
        "week": week of month,
        "i": index of this element in this array,
        "entrances": entrances in this time bucket across all stops,
        "exits": exits in this time bucket across all stops
      }, ...
    ]
  },
  "stops": [
    {
      "name": "name for this stop from turnstile data",
      "times": [
        {
          "time": unix timestamp in milliseconds,
          "hour": hour of day,
          "day": day of week,
          "week": week of month,
          "i": index of this element in this array,
          "entrances": entrances in this time bucket for this stop,
          "exits": exits in this time bucket for this stop
        }, ...
      ],
      "entrancesByType": {
        "offpeak": total number of entrances for this stop on a typical weekend/holiday,
        "weekday": total number of entrances for this stop on a typical weekday,
        "all": total number of entrances for this stop on a typical day
      },
      "averagesByType": {
        "offpeak": [
          {
            "hour": hour of day,
            "entrances": average entrances during this hour on a weekend/holiday,
            "exits": average exits during this hour on a weekend/holiday
          }
        ],
        "weekday": [
          {
            "hour": hour of day,
            "entrances": average entrances during this hour on a weekday,
            "exits": average exits during this hour on a weekday
          }
        ],
        "all": [
          {
            "hour": hour of day,
            "entrances": average entrances during this hour on any day,
            "exits": average exits during this hour on any day
          }
        ]
      }
    }
  ]
}