Version 1.0.2 beta - Please feed back any issues!
This is a small package to perform the following:
- Import any number of FCS files from a CyTOF v3 (Helios) (NOTE - the files should be normalised and/or concatenated either by CyTOF software or the Finck method before using CyTOFClean! See link below explaining how CyTOF FCS files are affected by any non-Fluidigm analysis tools)
- Auto-gate the Event Length
- Auto-gate the Gaussian parameters (Centre -> Offset - Residual -> Width)
- Option to auto-gate the cells (based on finding the clearest separation of cells vs. beads in one of the bead channels)
- Output new FCS files in a subdirectory called "CyTOFClean" (they will have "CC" (short for CyTOFClean) added to their names, or timestamps if they already exist)
- Output a plot (PNG) of the gates used
e.g. as follows:
- Gating on Event, Gaussian and Beads (Cells) should be easy enough for a computer to do.
- Reduced file size - typically, an 80% reduction! This is primarily due to the removal of the extra Fluidigm data, which is removed after doing any import -> export of a CyTOF FCS file - e.g. See El-ad's YouTube video. This is beneficial as it reduces upload times and storage requirements for further analysis (e.g. upload to Cytobank and Omiq).
- Save time doing boring gating - spend your time gating on the real data / markers of interest! CyTOFClean is FAST - e.g. 13 seconds for an 800MB FCS file with 1,000,000 events.
- I enjoy playing with data and R.
- Learning to build my first package.
Fluidigm's website is pretty thin when it comes to explaining exactly what these are.
In simplistic terms, just like gating on the Event Length removes any spurious or "bad" data (such as ion cloud fusions), gating on the Gaussians further ensures that the data to be further analysed is of the highest quality. Further details can be found in the following publications:
Fluidigim Technical Note - See pages 5-7.
Automated Data Cleanup for Mass Cytometry
Multi-site reproducibility using CyTOF
Acquisition, Processing and Quality Control of Mass Cytometry Data
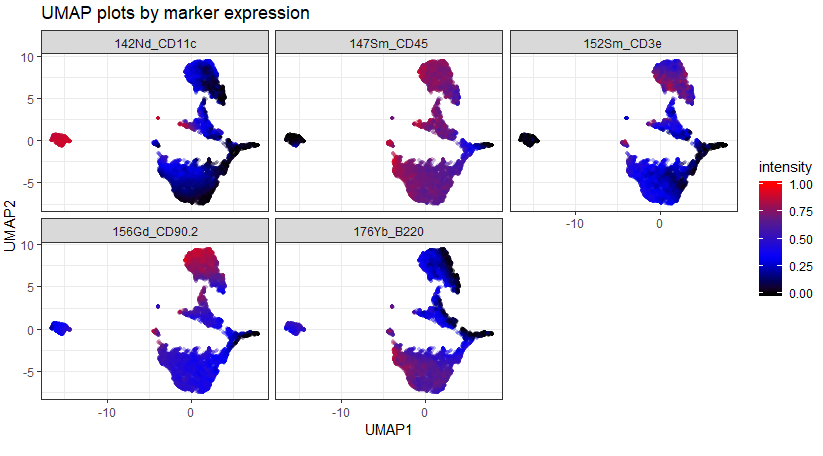
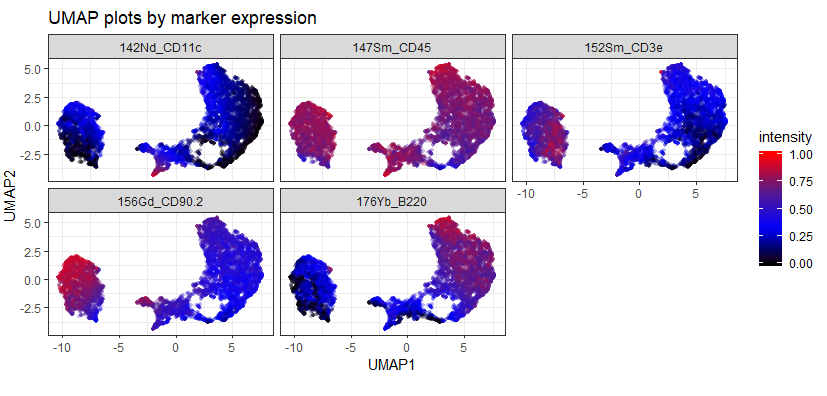
As an example of the difference between the data that comes straight off the instrument vs. data that's been cleaned using Event Length and Gaussians, compare the following two UMAP plots:


The first, upper, plot is the data as it comes off the instrument. Notice there are a few "islands" that sit quite far from the bulk of the data and have very high and very low expression of some markers. This suggests that they could be aggregates / ion cloud fusions (high marker expression) or junk or EQ beads (low / zero expression).
The second, lower, plot is the same dataset after being automatically cleaned using CyTOFClean. The islands have gone and we have a much clearer view of the data. Admittedly, I'm "cheating" a little here and making CyTOFClean look better / cleverer than it really is because it also does simple, standard things like gate on the Event Length and remove the beads as well as clean up the data using the Gaussian parameters. The upper plot is therefore probably not what most people would use for their downstream analysis.
I've tested this script on quite a few datasets and it seems fairly robust. I figure that, even if it fails to clean up the data, not much has been lost because the processing is fast and new files are created.
At first, I started designing a Shiny GUI, which would allow me to show the plots and run in a browser window, with a more attractive interface. However, uploading files, even to a local instance of Shiny is incredibly slow, which defeats the purpose of a fast, simple script like this (it would take longer to upload the file than to process it!).
In addition, I've considered adding user-specified options, such as "filter strength" to allow tuning of the gates. This could probably be combined with an option to show the plots for feedback. But again, this somewhat defeats the purpose of the script, and you may as well gate manually if you want to change the output. Feedback would be welcome for anything that may be useful, as well as anything that may go wrong with the script once it's used on more datasets!
Run the below, which will:
- Ensure devtools is installed (needed to install packages from github)
- Download and install the CyTOFClean package (as well as its dependencies - tcltk2, flowCore, ggplot2, cowplot and scales)
- Load the package
- Run the GUI
if(!require(devtools)){
  install.packages("devtools") # If not already installed
}

if(!require(cytofclean)){
  devtools::install_github("JimboMahoney/cytofclean", dependencies = TRUE)
}

library("cytofclean")

cytofclean_GUI()
I modified some of the cytofkit code to create the GUI. Hope this is OK!
Thanks also to El-ad of Astrolabe Diagnostics for his advice on using the density function instead of histogram smoothing and to Mike Leipold of Stanford for his words of caution on gating beads. (Name-dropping them here doesn't mean they were involved in the development of this code - just in alerting me to some data-handling and gotchas!).
A much more complex package for flow cytometry data - flowAI.
Bioconductor
Original Paper
UPDATE Version 1.0: CyTOFClean now transforms the Gaussian parameters and bead channels like cytobank. e.g. using an arcsinh cofactor 5 transform and scaling. Imporantly, it does this in a copy of the data, not the original data. Thus the output graphs will have a similar, but not identical, scale to that of cytobank. This has dramatically improved the robustness and made CyTOFClean much less aggressive in its gating.
For the Event Length and Gaussian parameters, CyTOFClean uses the density function to "see" the spread of the data. Where the bulk of the events are located, it will apply a cutoff at a certain density value. This ensures that the shape (i.e. bias or skew) of the data is taken into account. Event Length could probably be made more stringent - i.e. something like this paper. However, I've taken the approach that CytofClean should "undergate" rather than "overgate" - i.e. you can always tighten up the gates later if you wish. Event Length is probably the only one you may wish to do this with, to further remove doublets / ion cloud fusions.
The Gaussian parameters tend to be more symmetrical, but each are slightly different, so CyTOFClean has been "trained" on a multitude of "good" and "bad" datasets to ensure it tends to produce sensible results in all cases.
There are some parameters (the Gaussians) that have "safety limits" applied - e.g. preventing negative or zero values - that are only necessary in "bad" datasets.
The removal of beads is much more challenging. This is primarily because CyTOFClean has no idea whether the bead channels (140, 151, 153, 165 and 175) have also been used for cell markers.
UPDATE Version 1.0 - The user can specify which bead channel(s) to use. If more than one channel is selected, CyTOFClean will determine which is the "best" channel to use as per the below.
It will first look for which of these channels is present in the data. It will then use the density function of each to determine which is the most suitable for bead discrimination. It does this by finding the channel with the clearest bead signal / separation between beads and not-beads.
It then uses only this channel to remove the beads by setting the threshold to a suitable value below the bead signal.
Of all the processing that CyTOFClean does, this is the most likely to fail or produce eroneous results, hence it's optional.
Having said that, I haven't seen it fail on any of the data available to me, which includes data in which almost all the bead channels are also used as cell markers.
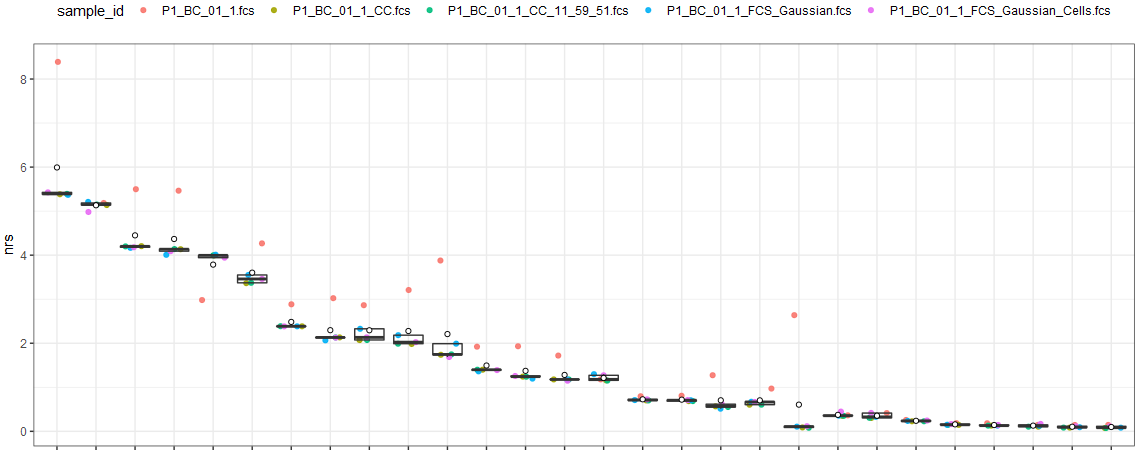
As part of my testing, I compared an original file together with CyTOFClean with bead removal; without bead removal and manual gating using Gaussian paramaters and manual gating of Gaussian parameters and cells.
Using my other script, NRS, the following can be seen:
The first file, shown with a red dot, is the original "raw" FCS as it comes off the CyTOF. The second (tan) and third (green) files are from CyTOFClean - the first is "fully gated", including bead removal. The second is only using Gaussian parameters. The fourth (blue) and fifth (green) files are manually gated - the first is gated only using Gaussians, the second is further gated to exclude beads.
(I've deliberately hidden the markers, as they are confidential.)
As with any piece of software, there may be bugs, so please report any issues.
CyTOFClean should be pretty safe to use because it creates new files, rather than altering existing ones. Plus, it shows you plots of how it's gated the files. However, like any tool, it should not be relied upon for ensuring that your data is clean / scientifically valid.
You will need to do further gating / clean-up (e.g. Live/Dead, doublets, as well as looking at the Event Length) to determine if you are happy with the data.

