


A PHP library for pushing data into Geckoboard custom widgets (http://www.geckoboard.com/developers/custom-widgets/widget-types)
The best way to install the library is by using Composer. Add the following to composer.json in the root of your project:
{
    "require": {
        "carlosio/geckoboard": "1.*"
    }
}
Then, on the command line:
curl -s http://getcomposer.org/installer | php
php composer.phar install
Use the generated vendor/autoload.php file to autoload the library classes.
require __DIR__ . '/vendor/autoload.php'; //locate accordingly
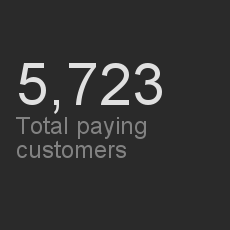
use CarlosIO\Geckoboard\Widgets\NumberAndSecondaryStat;
use CarlosIO\Geckoboard\Client; //Client is only needed for push
$widget = new NumberAndSecondaryStat();
$widget->setId('<your widget id>');
$widget->setMainValue(123);
$widget->setSecondaryValue(238);
$widget->setMainPrefix('EUR');
$geckoboardClient = new Client();
$geckoboardClient->setApiKey('<your token>');
$geckoboardClient->push($widget);
/* if polling, remove/comment ^^^ the previous line and add these lines:
$widget_return =$widget->getData();
echo json_encode($widget_return);
*/
use CarlosIO\Geckoboard\Widgets\NumberAndSecondaryStat;
use CarlosIO\Geckoboard\Client;

$widget = new NumberAndSecondaryStat();
$widget->setId('<your widget id>');
$widget->setMainValue(123);
$widget->setSecondaryValue(238);
$widget->setMainPrefix('EUR');

$geckoboardClient = new Client();
$geckoboardClient->setApiKey('<your token>');
$geckoboardClient->push($widget);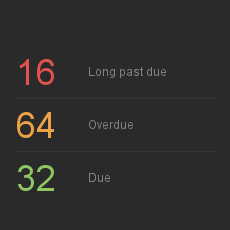
use CarlosIO\Geckoboard\Data\Entry;
use CarlosIO\Geckoboard\Widgets\RagNumbers;
use CarlosIO\Geckoboard\Client;

$widget = new RagNumbers();
$widget->setId('<your widget id>');

$redData = new Entry();
$redData->setValue(132)->setText('This is the red description');
$widget->setRedData($redData);

$amberData = new Entry();
$amberData->setValue(134)->setText('This is the amber description');
$widget->setAmberData($amberData);

$greenData = new Entry();
$greenData->setValue(34)->setText('This is the green description');
$widget->setGreenData($greenData);

$geckoboardClient->push($widget);
use CarlosIO\Geckoboard\Data\Entry;
use CarlosIO\Geckoboard\Widgets\RagColumnAndNumbers;
use CarlosIO\Geckoboard\Client;

$widget = new RagColumnAndNumbers();
$widget->setId('<your widget id>');

$redData = new Entry();
$redData->setValue(132)->setText('This is the red description');
$widget->setRedData($redData);

$amberData = new Entry();
$amberData->setValue(13)->setText('This is the amber description');
$widget->setAmberData($amberData);

$greenData = new Entry();
$greenData->setValue(3)->setText('This is the green description');
$widget->setGreenData($greenData);

$geckoboardClient->push($widget);
use CarlosIO\Geckoboard\Widgets\Text;
use CarlosIO\Geckoboard\Data\Text\Item;
use CarlosIO\Geckoboard\Client;

$widget = new Text();
$widget->setId('<your widget id>');

$firstItem = new Item();
$secondItem = new Item();

$firstItem->setText('Test message 1');

$secondItem->setText('Test message 2');
$secondItem->setType(Item::TYPE_ALERT);

$widget->addItem($firstItem);
$widget->addItem($secondItem);

$geckoboardClient->push($widget);
use CarlosIO\Geckoboard\Data\Funnel\Entry;
use CarlosIO\Geckoboard\Widgets\Funnel;
use CarlosIO\Geckoboard\Client;

$widget = new Funnel();
$widget->setId('<your widget id>');
$widget->setType('reversed');
$widget->setShowPercentage(false);

$error = new Entry();
$error->setLabel('Step 1')->setValue(87809);
$widget->addEntry($error);

$error = new Entry();
$error->setLabel('Step 2')->setValue(70022);
$widget->addEntry($error);

$error = new Entry();
$error->setLabel('Step 3')->setValue(63232);
$widget->addEntry($error);

$error = new Entry();
$error->setLabel('Step 4')->setValue(53232);
$widget->addEntry($error);

$error = new Entry();
$error->setLabel('Step 5')->setValue(32123);
$widget->addEntry($error);

$error = new Entry();
$error->setLabel('Step 6')->setValue(23232);
$widget->addEntry($error);

$error = new Entry();
$error->setLabel('Step 7')->setValue(12232);
$widget->addEntry($error);

$error = new Entry();
$error->setLabel('Step 8')->setValue(2323);
$widget->addEntry($error);

$geckoboardClient->push($widget);
use CarlosIO\Geckoboard\Data\PieChart\Entry;
use CarlosIO\Geckoboard\Widgets\PieChart;
use CarlosIO\Geckoboard\Client;

$widget = new PieChart();
$widget->setId('<your widget id>');

$entry = new Entry();
$entry->setLabel('May')->setValue(100)->setColor('ffff10');
$widget->addEntry($entry);

$entry = new Entry();
$entry->setLabel('June')->setValue(160)->setColor('ffaa0a');
$widget->addEntry($entry);

$entry = new Entry();
$entry->setLabel('July')->setValue(300)->setColor('ff5505');
$widget->addEntry($entry);

$entry = new Entry();
$entry->setLabel('August')->setValue(140)->setColor('ff0000');
$widget->addEntry($entry);

$geckoboardClient->push($widget);
use CarlosIO\Geckoboard\Data\Entry;
use CarlosIO\Geckoboard\Widgets\GeckoMeter;
use CarlosIO\Geckoboard\Client;

$widget = new GeckoMeter();
$widget->setId('<your widget id>');

$minentry = new Entry();
$minentry->setValue(0);
$widget->setMinData($minentry);

$maxentry = new Entry();
$maxentry->setValue(100);
$widget->setMaxData($maxentry);

$widget->setValue(23); //set your datapoint value

$geckoboardClient->push($widget);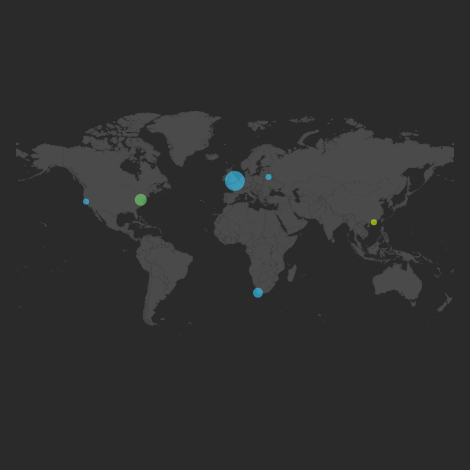
use CarlosIO\Geckoboard\Data\Point;
use CarlosIO\Geckoboard\Widgets\Map;
use CarlosIO\Geckoboard\Client;

$widget = new Map();
$widget->setId('<your widget id>');

$point = new Point();
$point->setSize(10)->setColor('FF0000')->setLatitude('40.416775')->setLongitude('-3.70379');
$widget->addPoint($point);

$geckoboardClient->push($widget);
require '../gecko/vendor/autoload.php'; //locate accordingly

use CarlosIO\Geckoboard\Data\LineChart2\Entry;
use CarlosIO\Geckoboard\Widgets\LineChart2;


$widget = new LineChart2();

$entry = new Entry();
$entry->setFormatyAxis('currency');
$entry->setUnityAxis('USD');
$entry->setLabelsxAxis("Jan");
$entry->setLabelsxAxis("Feb");
$entry->setLabelsxAxis("Mar");
$entry->setLabelsxAxis("Apr");
$entry->setLabelsxAxis("May");
$entry->setLabelsxAxis("Jun");
$entry->setLabelsxAxis("Jul");
$entry->setLabelsxAxis("Aug");
$entry->setLabelsxAxis("Sep");
$entry->setLabelsxAxis("Oct");
$entry->setLabelsxAxis("Nov");
$entry->setLabelsxAxis("Dec");

//add 1st series data. data is stored/grouped by the series name
$seriesName = 'GBP -> USD'; //setting this makes life easier
$entry->addSeries($seriesName);
$entry->addSeriesValue($seriesName,1.62529);
$entry->addSeriesValue($seriesName,1.56991);
$entry->addSeriesValue($seriesName,1.50420);
$entry->addSeriesValue($seriesName,1.52265);
$entry->addSeriesValue($seriesName,1.55356);
$entry->addSeriesValue($seriesName,1.51930);
$entry->addSeriesValue($seriesName,1.52148);
$entry->addSeriesValue($seriesName,1.51173);
$entry->addSeriesValue($seriesName,1.52148);
$entry->addSeriesValue($seriesName,1.55170);
$entry->addSeriesValue($seriesName,1.61966);
$entry->addSeriesValue($seriesName,1.59255);
$entry->addSeriesValue($seriesName,1.63762);

//add 2nd series data.
$seriesName = 'USD -> GBP';
$entry->addSeries($seriesName);
$entry->addSeriesValue($seriesName,1.42529);
$entry->addSeriesValue($seriesName,1.46991);
$entry->addSeriesValue($seriesName,1.40420);
$entry->addSeriesValue($seriesName,1.42265);
$entry->addSeriesValue($seriesName,1.45356);
$entry->addSeriesValue($seriesName,1.41930);
$entry->addSeriesValue($seriesName,1.42148);
$entry->addSeriesValue($seriesName,1.41173);
$entry->addSeriesValue($seriesName,1.42148);
$entry->addSeriesValue($seriesName,1.45170);
$entry->addSeriesValue($seriesName,1.51966);
$entry->addSeriesValue($seriesName,1.49255);
$entry->addSeriesValue($seriesName,1.53762);
$widget->addEntry($entry);

$widget_return =$widget->getData();
echo json_encode($widget_return);
It seems that a series of type, datetime is considered a scatter series and so X-Axis labels are not allowed. Setting incomplete will change the solid plot-line to a broken plot-line
require '../gecko/vendor/autoload.php'; //locate accordingly

use CarlosIO\Geckoboard\Data\LineChart2\Entry;
use CarlosIO\Geckoboard\Widgets\LineChart2;


$widget = new LineChart2();
//$widget->setId('<your widget id>');
//$widget->setId('769871-62cd28d0-1af1-0138-447b-0e571bc713b0');

$entry = new Entry();
$entry->setFormatyAxis('currency');
$entry->setUnityAxis('USD');
$seriesName = 'GBP -> USD';
$entry->setSeriesType('datetime'); //Geckoboard will expect some form of date/datetime data on the X axis.
$entry->setSeriesIncomplete('2019-12'); //value given has to match an X value in the series data.
$entry->addSeries($seriesName);
//$entry->addSeriesValue($seriesName,$valueX,$valueY); // $valueX is optional, valuex maybe a datetime if series type is defined as datetime and xlabels are not set

$entry->addSeriesValue($seriesName,'2019-01',1.56991);
$entry->addSeriesValue($seriesName,'2019-02',1.50420);
$entry->addSeriesValue($seriesName,'2019-03',1.52265);
$entry->addSeriesValue($seriesName,'2019-04',1.55356);
$entry->addSeriesValue($seriesName,'2019-05',1.51930);
$entry->addSeriesValue($seriesName,'2019-06',1.52148);
$entry->addSeriesValue($seriesName,'2019-07',1.51173);
$entry->addSeriesValue($seriesName,'2019-08',1.52148);
$entry->addSeriesValue($seriesName,'2019-09',1.55170);
$entry->addSeriesValue($seriesName,'2019-10',1.61966);
$entry->addSeriesValue($seriesName,'2019-11',1.59255);
$entry->addSeriesValue($seriesName,'2019-12',1.63762);

$widget->addEntry($entry);

$widget_return =$widget->getData();

echo json_encode($widget_return);require '../gecko/vendor/autoload.php'; //locate accordingly
use CarlosIO\Geckoboard\Data\LineChart2\Entry;
use CarlosIO\Geckoboard\Widgets\LineChart2;
use CarlosIO\Geckoboard\Client;
$widget = new LineChart2();
$widget->setId('<your widget id>'); //get this from the setup of dashboard tile
$entry = new Entry();
$entry->setFormatyAxis('currency');
$entry->setUnityAxis('USD');
$entry->setLabelsxAxis("Jan");
$entry->setLabelsxAxis("Feb");
$entry->setLabelsxAxis("Mar");
$entry->setLabelsxAxis("Apr");
$entry->setLabelsxAxis("May");
$entry->setLabelsxAxis("Jun");
$entry->setLabelsxAxis("Jul");
$entry->setLabelsxAxis("Aug");
$entry->setLabelsxAxis("Sep");
$entry->setLabelsxAxis("Oct");
$entry->setLabelsxAxis("Nov");
$entry->setLabelsxAxis("Dec");
//add 1st series data. data is stored/grouped by the series name
$seriesName = 'GBP -> USD'; //setting this makes life easier
$entry->addSeries($seriesName);
$entry->addSeriesValue($seriesName,1.62529);
$entry->addSeriesValue($seriesName,1.56991);
$entry->addSeriesValue($seriesName,1.50420);
$entry->addSeriesValue($seriesName,1.52265);
$entry->addSeriesValue($seriesName,1.55356);
$entry->addSeriesValue($seriesName,1.51930);
$entry->addSeriesValue($seriesName,1.52148);
$entry->addSeriesValue($seriesName,1.51173);
$entry->addSeriesValue($seriesName,1.52148);
$entry->addSeriesValue($seriesName,1.55170);
$entry->addSeriesValue($seriesName,1.61966);
$entry->addSeriesValue($seriesName,1.59255);
$entry->addSeriesValue($seriesName,1.63762);
//add 2nd series data.
$seriesName = 'USD -> GBP';
$entry->addSeries($seriesName);
$entry->addSeriesValue($seriesName,1.42529);
$entry->addSeriesValue($seriesName,1.46991);
$entry->addSeriesValue($seriesName,1.40420);
$entry->addSeriesValue($seriesName,1.42265);
$entry->addSeriesValue($seriesName,1.45356);
$entry->addSeriesValue($seriesName,1.41930);
$entry->addSeriesValue($seriesName,1.42148);
$entry->addSeriesValue($seriesName,1.41173);
$entry->addSeriesValue($seriesName,1.42148);
$entry->addSeriesValue($seriesName,1.45170);
$entry->addSeriesValue($seriesName,1.51966);
$entry->addSeriesValue($seriesName,1.49255);
$entry->addSeriesValue($seriesName,1.53762);
$widget->addEntry($entry);
$geckoboardClient = new Client();
$geckoboardClient->setApiKey('<your token>'); //get this from your dashboard account settings
$geckoboardClient->push($widget);use CarlosIO\Geckoboard\Widgets\LineChart;
use CarlosIO\Geckoboard\Client;
$widget = new LineChart();
$widget->setId('<your widget id>');
$widget->setItems(array(1, 1.23));
$widget->setColour("ff0000");
$widget->setAxis(LineChart::DIMENSION_X, array("min", "max"));
$widget->setAxis(LineChart::DIMENSION_Y, array("bottom", "top"));
$geckoboardClient->push($widget);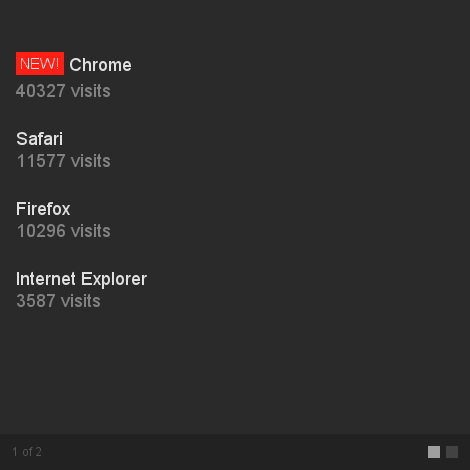
use CarlosIO\Geckoboard\Data\ItemList\Label;
use CarlosIO\Geckoboard\Data\ItemList\Title;
use CarlosIO\Geckoboard\Widgets\ItemList;
use CarlosIO\Geckoboard\Client;

$widget = new ItemList();
$widget->setId('<your widget id>');

$title = new Title();
$title->setText("Title text");
$title->setHighlight(true);

$title2 = new Title();
$title2->setText("Title2 text");
$title2->setHighlight(false);

$label = new Label();
$label->setName("Label name");
$label->setColor("red");

$label2 = new Label();
$label2->setName("Label2 name");
$label2->setColor("blue");

$widget->addItem($title, $label, 'description1');
$widget->addItem($title2, $label2, 'description2');

$geckoboardClient->push($widget);
require '../gecko/vendor/autoload.php';
use CarlosIO\Geckoboard\Widgets\Monitoring;
use CarlosIO\Geckoboard\Client;

$widget = new Monitoring();

$widget->setId('<your widget id>');
$widget->setStatus('Up');
$widget->setDownTime('3 days ago');
$widget->setResponseTime('100 ms');

$geckoboardClient()->push($widget);
require '../gecko/vendor/autoload.php';
use CarlosIO\Geckoboard\Data\LeaderBoard\Item;
use CarlosIO\Geckoboard\Widgets\LeaderBoard;
use CarlosIO\Geckoboard\Client;

$widget = new LeaderBoard();
$widget->setId('<your widget id>')

$item = new Item();
$item->setLabel("Title text")
    ->setValue(10)
    ->setPreviousRank(2);
$widget->addItem($item);

$item = new Item();
$item->setLabel("Title text 2")
    ->setValue(7)
    ->setPreviousRank(1);
$widget->addItem($item);

$geckoboardClient()->push($widget);$widgets = array();
$widget = new LineChart();
// Fill your line chart...
$widgets[] = $widget;
$widget = new Map();
// Fill your map...
$widgets[] = $widget;
$geckoboardClient->push($widgets);Use setGuzzleConfig() to pass config options directly to Guzzle.
$geckoboardClient = new Client();
$geckoboardClient->setApiKey('<your token>');
$geckoboardClient->setGuzzleConfig(array('timeout' => 30, 'connect_timeout' => 3));
$geckoboardClient->push($widget);In order to run the test, install all dependencies: php composer.phar install
$ bin/phpunit --coverage-text