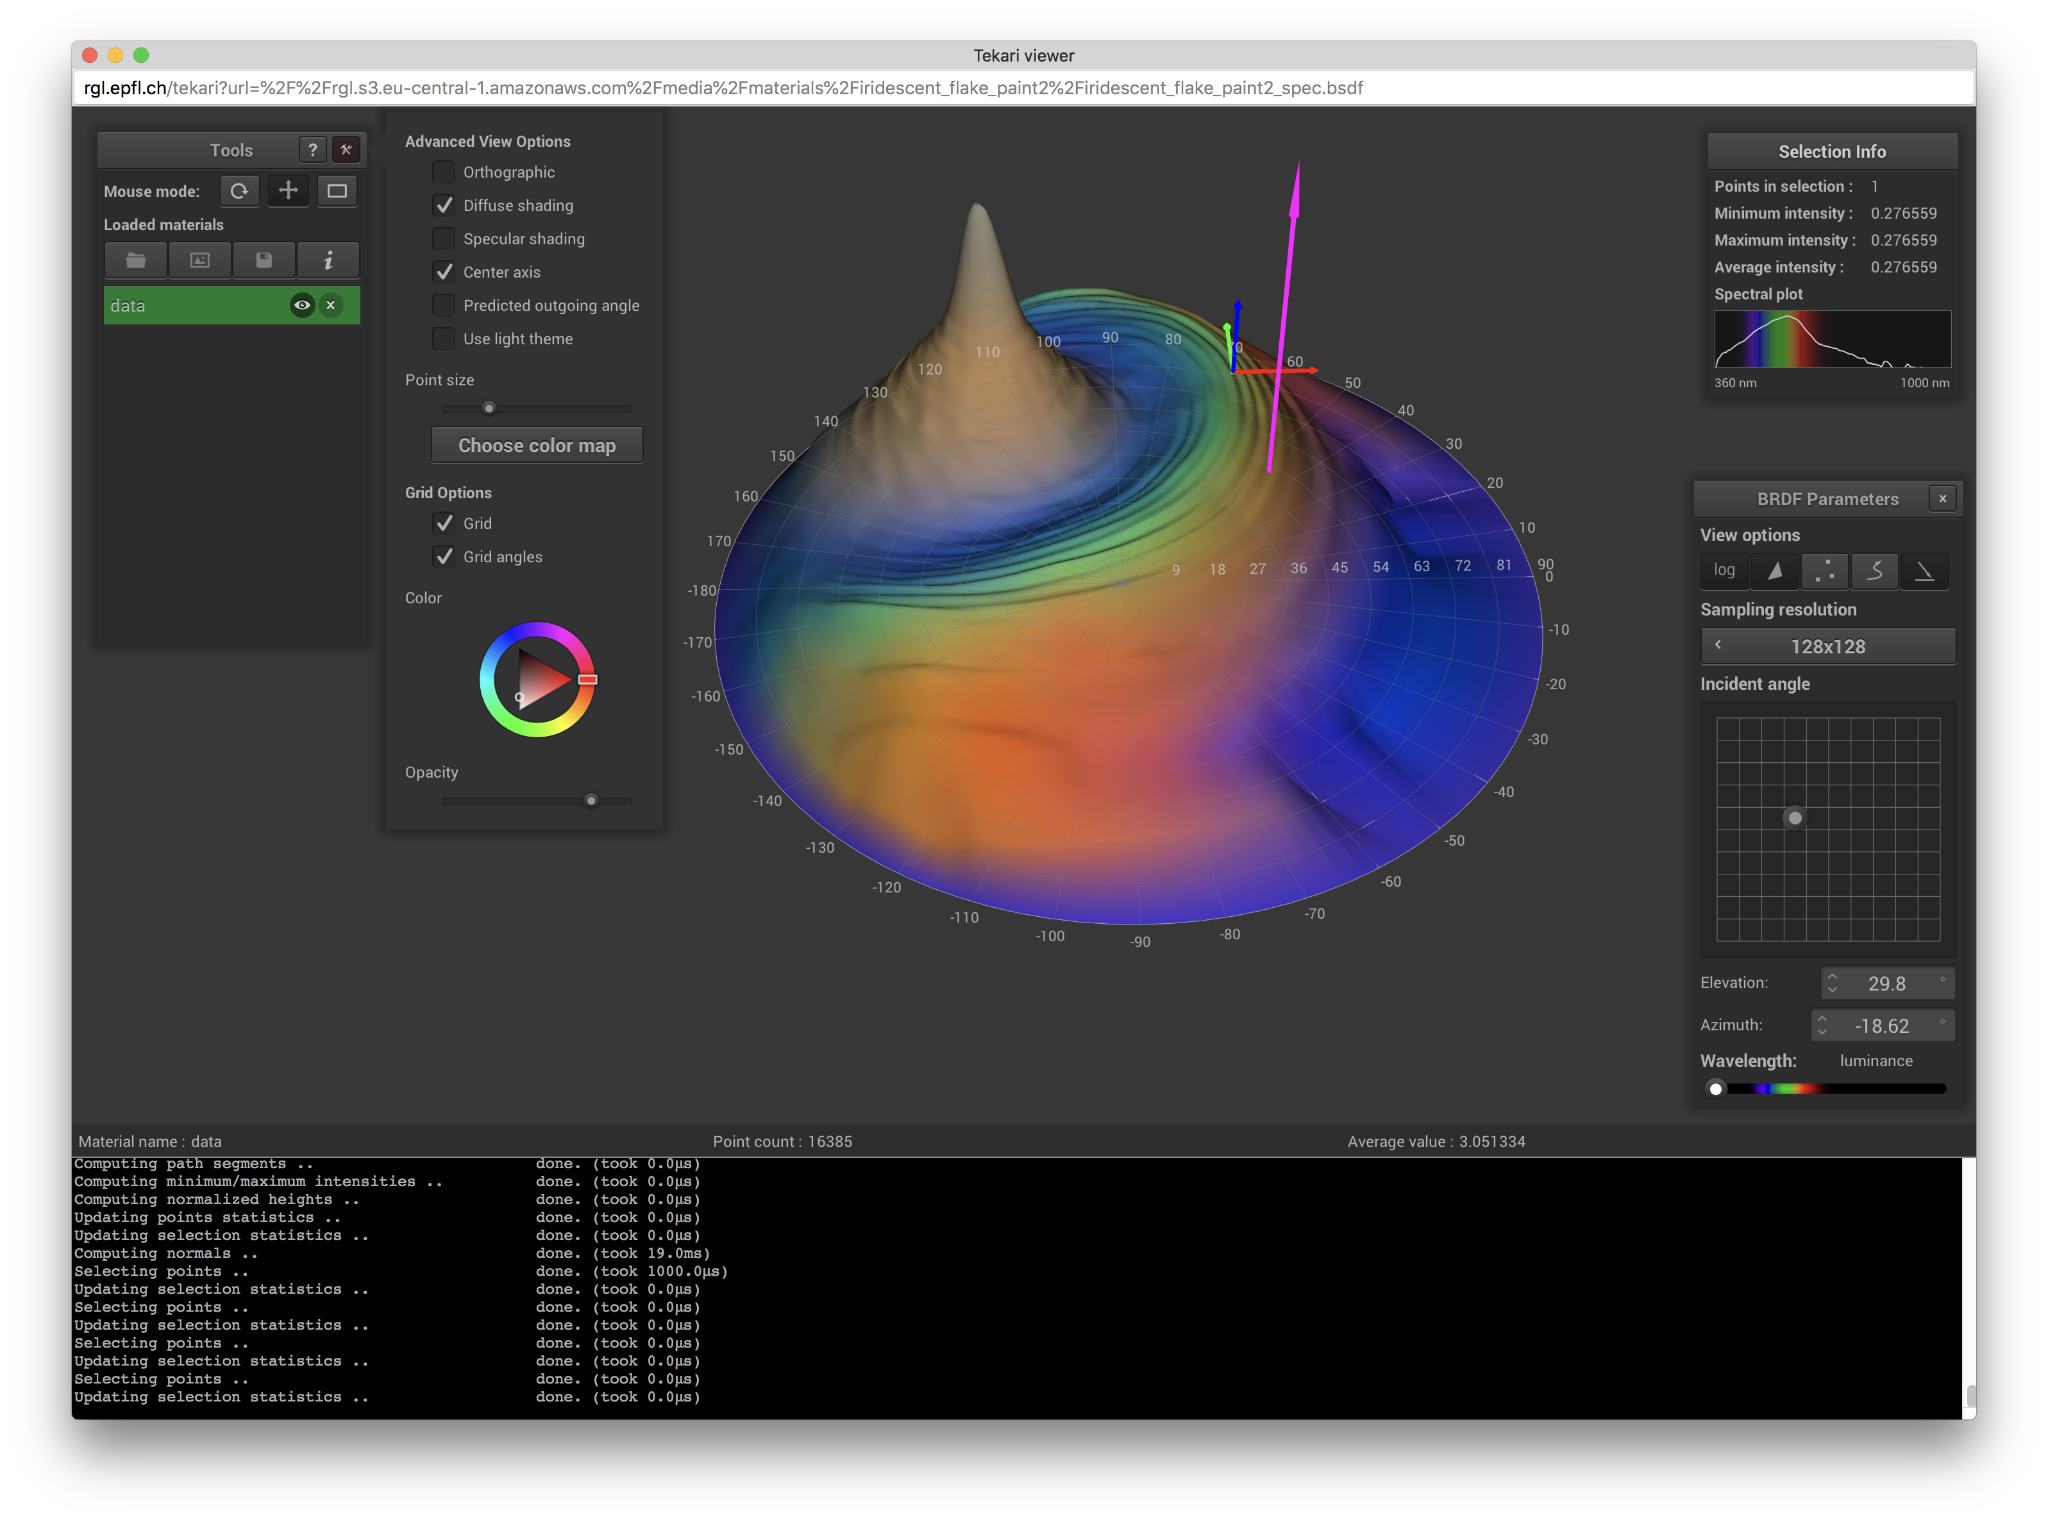
A BSDF-data visualization and editing tool.
 A example of workflow with Tekari, with multiple files open, some points selected and the color map selection window displayed.
You can launch Tekari in the command line and specify data samples to be loaded as command-line arguments:
./tekari data_set_1 data_set_2 ...
This will launch Tekari and open the specified files, assuming they are in the correct format (see file format).
To get started using Tekari, you first need to load a file, either using the command line, pressing the open file button (folder icon), or using Ctrl-O. Once you have a data sample loaded, you can interact with it in many ways:
- look at it from any angle (by left-dragging the mouse on the canvas)
- zoom in and out (using the mouse wheel)
- translate it (by middle-dragging the mouse)
- or also slect points (by right-dragging the mouse)
These are just the basics features that allow you to take a closer look at your data. If you want a more detailed explanation of the features (and associated shortcuts) supported by Tekari, you can just click the help button (top right of the tools window) or just press 'H' to bring up the help window. Hovering over any gui element will also display an helpful tooltip.
The two file formats Tekari supports are:
- standard or spectral data samples: these are texte files containing raw BSDF measurements generated by pgII.
- bsdf files: binary files with the .bsdf extension, computed from pgII measurements and processed following the paper An Adaptive Parameterization for Efficient Material Acquisition and Rendering by Jonathan Dupuy and Wenzel Jakob.
pgII is a goniophotometer used by RGL at EPFL. It is used to analyse the intensity of light reflected by a material at a given wavelength, or accross all the visible spectrum. It does so by scanning a material sample, following a hemisphere path, capturing the reflected light at precise angles. These raw measurements result in list of points with the format theta phi intensity (theta and phi being the angles, in degrees, at which the given intensity was measured). The format also includes some metadata at the beggining of the file, and even if most of it isn't required for Tekari to correctly load the file, the spectral data requires the first line (as there is no file extension distinguishing standard and spectral file formats).
All you need to compile tekari for desktop usage is a C++11 compiler. First, you'll need to clone the repo with the following command
$ git clone --recursive https://github.com/rgl-epfl/tekari
If you accidentally omitted the --recursive flag when cloning this repository you can initialize the submodules like so:
$ git submodule update --init --recursive
tekari uses CMake as its build system. The following sections detail how it should be used on various operating systems.
On macOS and most Linux distributions CMake can be obtained via a package manager (Homebrew on macOS, apt on Ubuntu/Debian, etc.). Most Linux distributions additionally require xorg, gl, and zlib development packages and zenity. On Ubuntu/Debian simply call
$ apt-get install cmake xorg-dev libglu1-mesa-dev zlib1g-dev zenity
Once all dependencies are installed, create a new directory to contain build artifacts, enter it, and then invoke CMake with the root tekari folder as argument as shown in the following example:
$ mkdir build
$ cd build
$ cmake ..
Afterwards, tekari can be built and run via
$ make tekari $ ./tekari
On Windows, install CMake, open the included GUI application, and point it to the root directory of tev. CMake will then generate Visual Studio project files for compiling tev. Make sure you select at least Visual Studio 2017 or higher!
Tekari has been developped at RGL by Benoît Ruiz under the supervision of Tizian Zeltner and Wenzel Jakob.