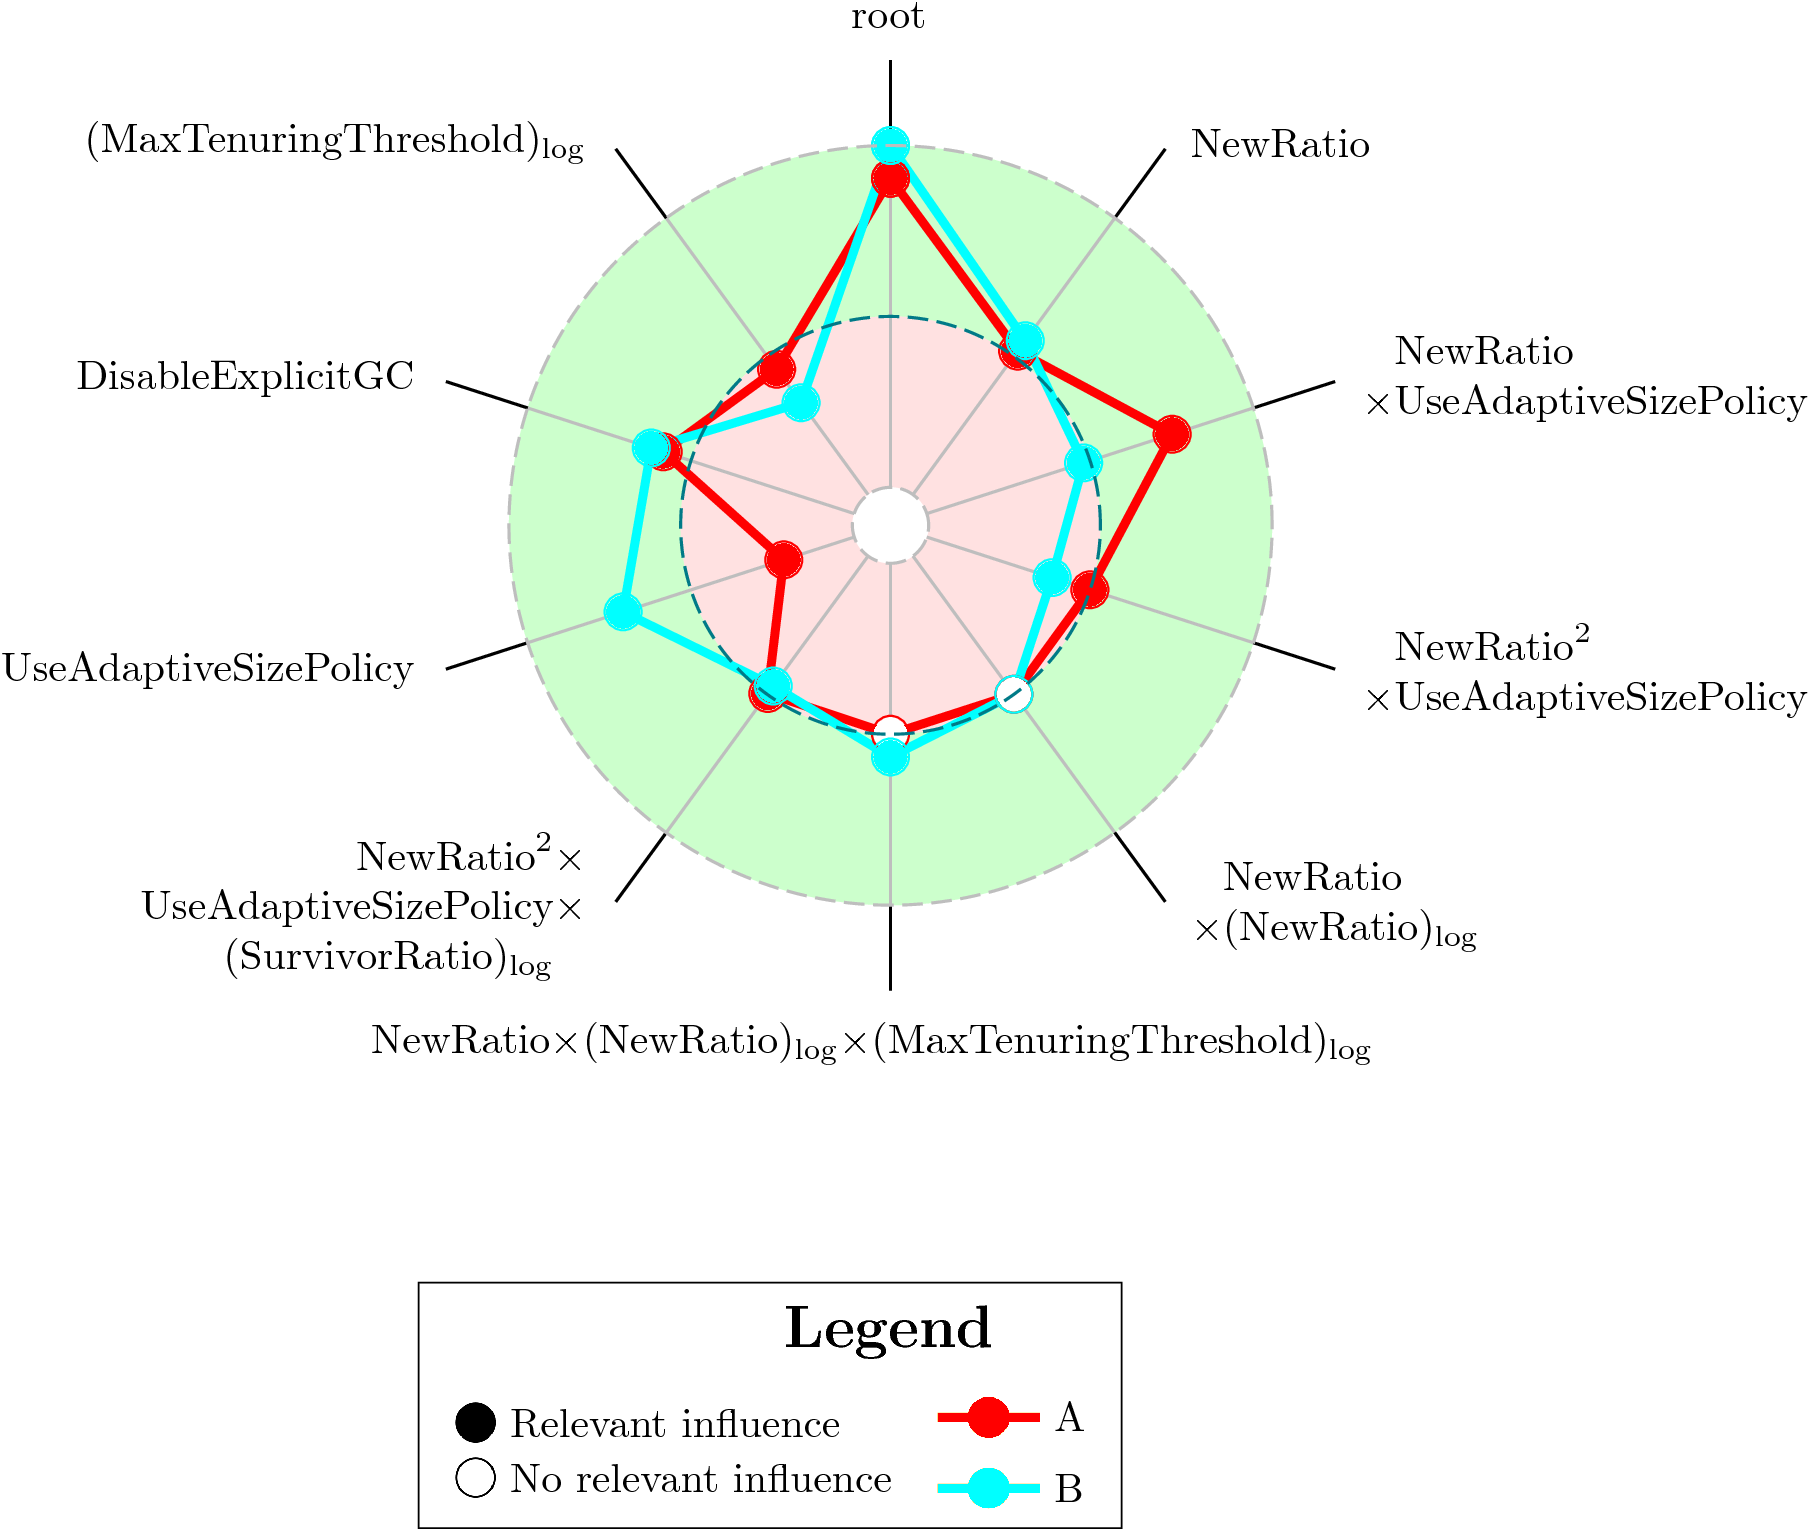
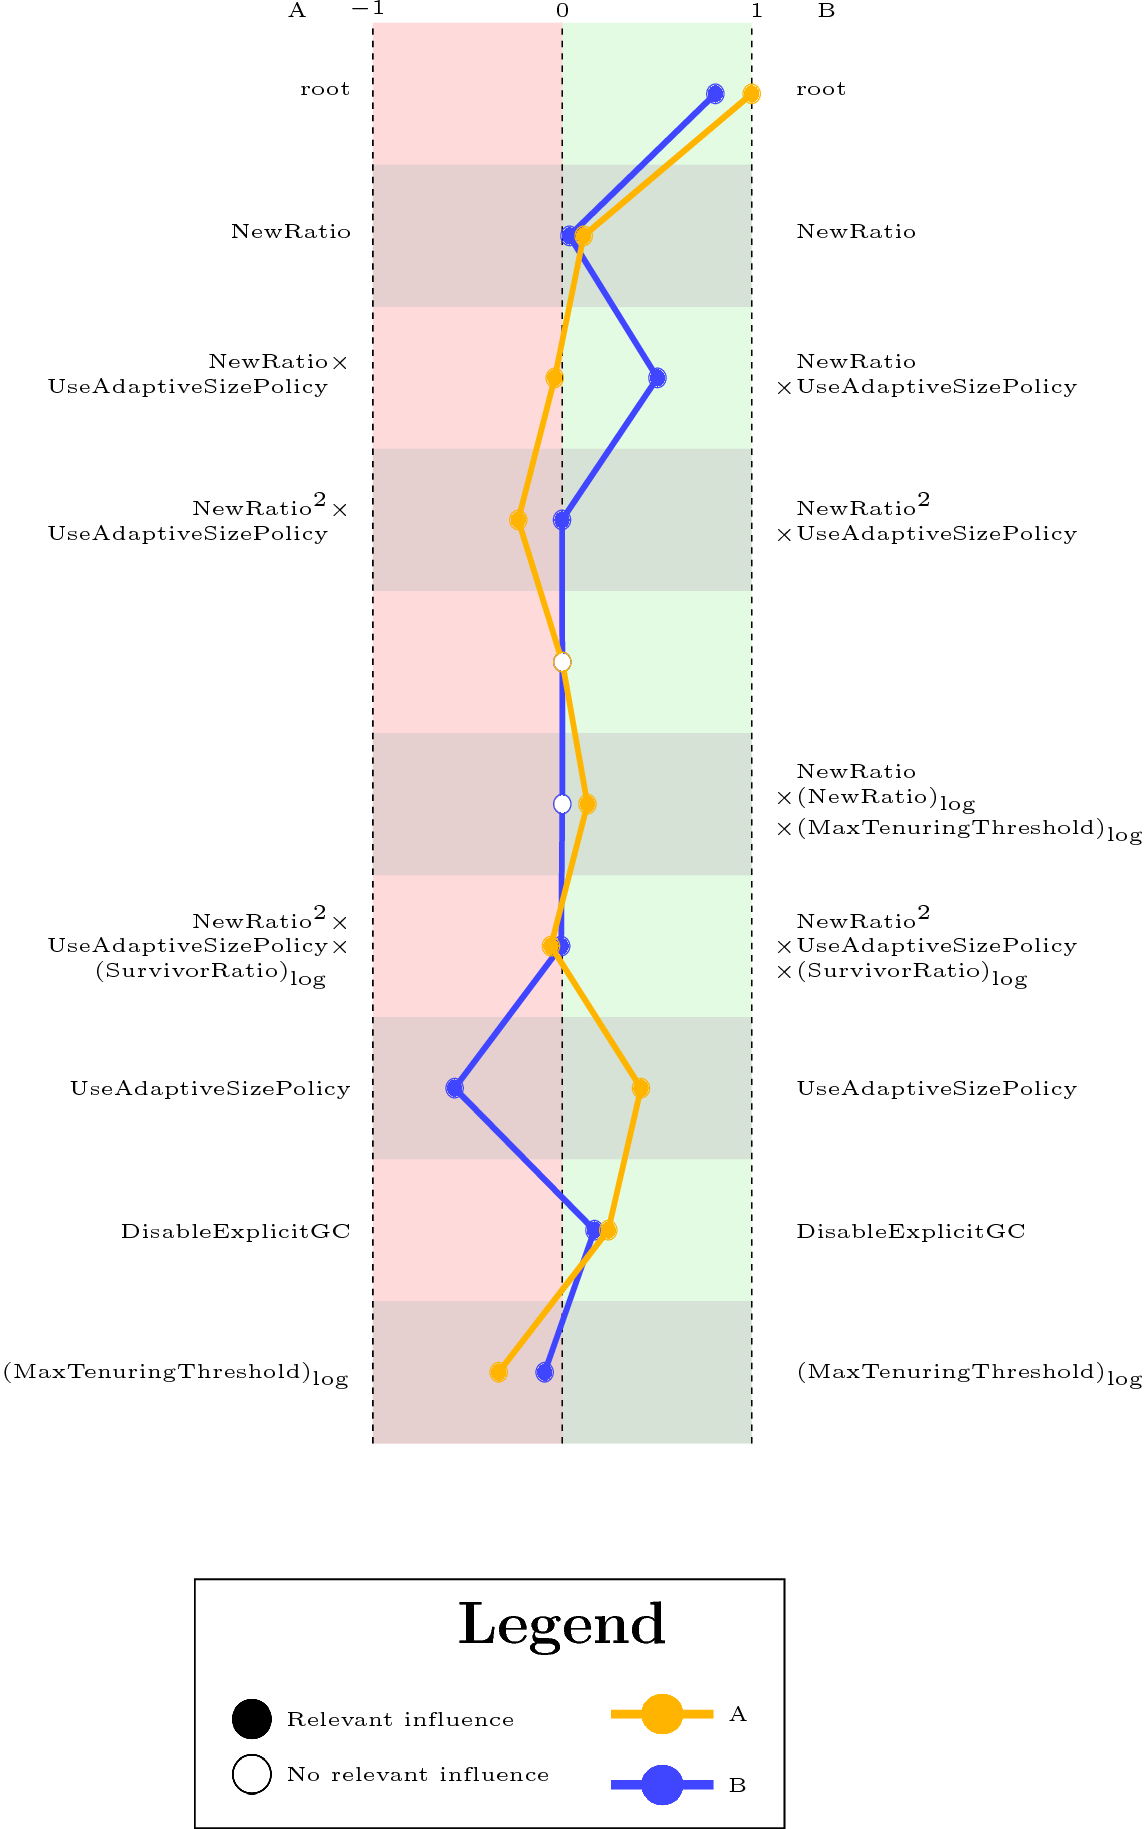
ViPe is a tool written in R and aims at simplifying the interpretation of performance-influence models by visualizing them. The tool provides different ways of visualizing performance-influence models to highlight different aspects, which are a representation as a text plot or a star plot.
Prior to executing ViPe, some libraries are required, which are:
- R
- LaTeX (Windows: MiKTeX; Linux: TeX Live)
- ImageMagick (for more detail on different operating systems see this link)
- R libraries that can be installed when invoking the shell or batch script (see Execution)
The tool is executed by invoking the file
- 'Visualizer.sh' for Ubuntu or cygwin
- 'Visualizer.bat' for Windows
To execute ViPe, certain program arguments are needed, which are as follows:
<PathToDirectoryWithCsvFiles> <PathToLibDir> [PathToRscript] [PathToVD] [PerformInstallation]
, where:
- PathToDirectoryWithCsvFiles is the path to the directory containing the performance models as .csv-files (see CSV File).
- PathToLibDir is the path where the libraries should be stored.
- PathToRscript (optional) is the path to the Rscript.exe file (only needed on Windows) - Default: Rscript
- PathToVD (optional) is the path to the .txt file containing the value domain of each feature (only required if installation has to be performed too). Can either be a valid path, or 'NONE' to indicate that no file exists (see Variability Model).
- PerformInstallation (optional) tells the script whether the installation of the libraries should be performed or not. As a program argument, you can use 'yes', but it is completely irrelevant.
For instance, the following call installs the needed libraries to '~/ViPe/libs/' and generates plots for the .csv files provided in '~/ViPe/Example/' without using a variability model:
./Visualizer.sh ~/ViPe/Examples/ ~/ViPe/libs/ /usr/bin/Rscript NONE yes
The output consists of .tex and .pdf files, which are written in the same directory as the .csv files.
An example for a star plot and a text plot
To use ViPe, one or more .csv files are needed that are arranged as follows:
| Group | <Option1> | <Option2> | <Interaction1> |
|---|---|---|---|
| A | 3.41 | -1.4 | 0.2 |
| B | 0 | 3.1 | 4.6 |
The column Group consists of the names that should be shown in the legend. The other columns represent the influences of individual configuration options or combinations among them. Furthermore, we also support mathematical functions, such as the logarithm function and different exponents. For instance, for a configuration option x, the expression log(x)^4 is supported by ViPe.
A variability model contains the configuration options and the relations/constraints among them. To generate a variability model, please refer to SPL Conqueror and its VariabilityModel_GUI.
Currently, the tool ViPe has no license. However, we plan to distribute ViPe under the GPLv2 license soon.
The radar plot is based on the implementation of Ricardio Bion and Paul Williamson.