Flotilla is a self-service framework that dramatically simplifies the process of defining and executing containerized jobs. This means you get to focus on the work you're doing rather than how to do it.
Once deployed, Flotilla allows you to:
- Define containerized jobs by allowing you to specify exactly what command to run, what image to run that command in, and what resources that command needs to run
- Run any previously defined job and access its logs, status, and exit code
- View and edit job definitions with a flexible UI
- Run jobs and view execution history and logs within the UI
- Use the complete REST API for definitions, jobs, and logs to build your own custom workflows
Flotilla is strongly opinionated about self-service for data science.
The core assumption is that you understand your work the best. Therefore, it is you who should own your work from end-to-end. In other words, you shouldn't need to be a "production engineer" to run your jobs or to access logs in case of problems. Do this with Flotilla.
Flotilla uses AWS's Elastic Kubernetes Service (EKS) as the execution backend. However, Flotilla does not manage EKS clusters. There must be at least one cluster defined in AWS's EKS service available to you and it must have at least one task node. Most typically this is the default cluster and examples will assume this going forward.
https://docs.aws.amazon.com/eks/latest/userguide/what-is-eks.html
You can run the service locally (which will still leverage AWS resources) using the docker-compose tool. From inside the repo run:
docker-compose up -d
You'll notice it builds the code in the repo and starts the flotilla service as well as the default postgres backend.
Verify the service is running by making a GET request with cURL (or navigating to in a web browser) the url http://localhost:5000/api/v6/task. A 200OK response means things are good!
Note: The default configuration under
confand in thedocker-compose.ymlassume port 3000. You'll have to change it in both places if you don't want to use port 3000 locally.
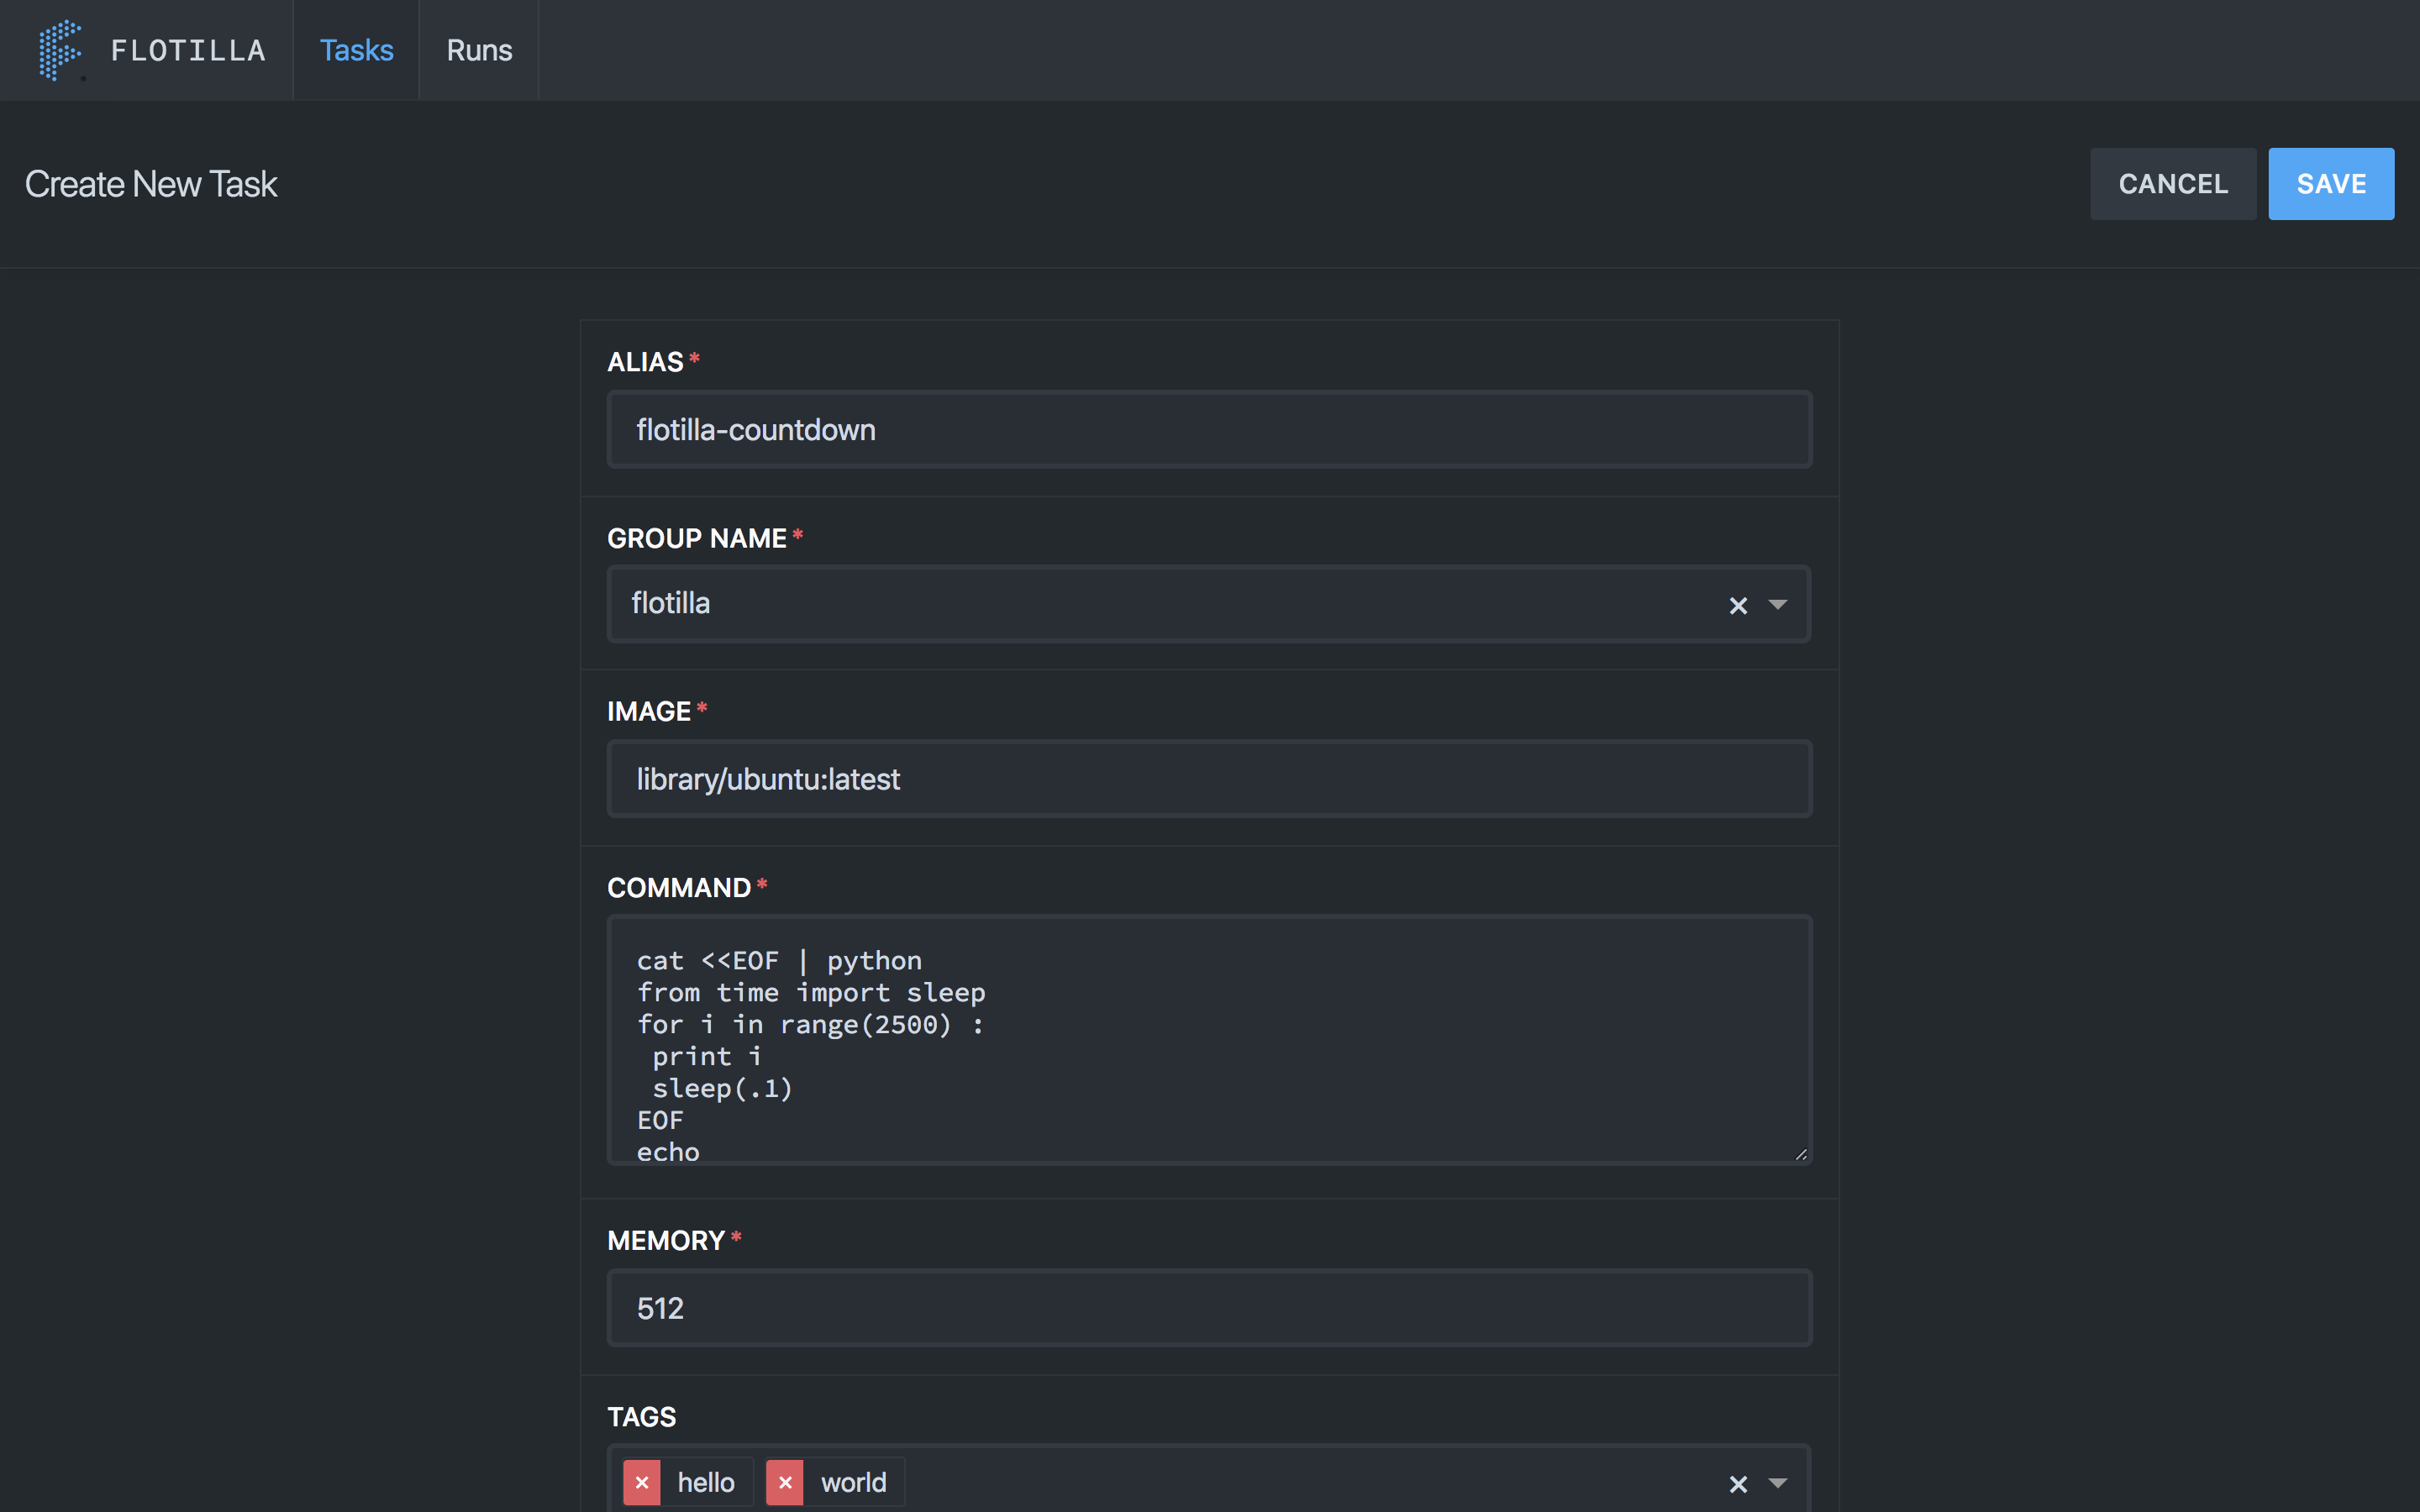
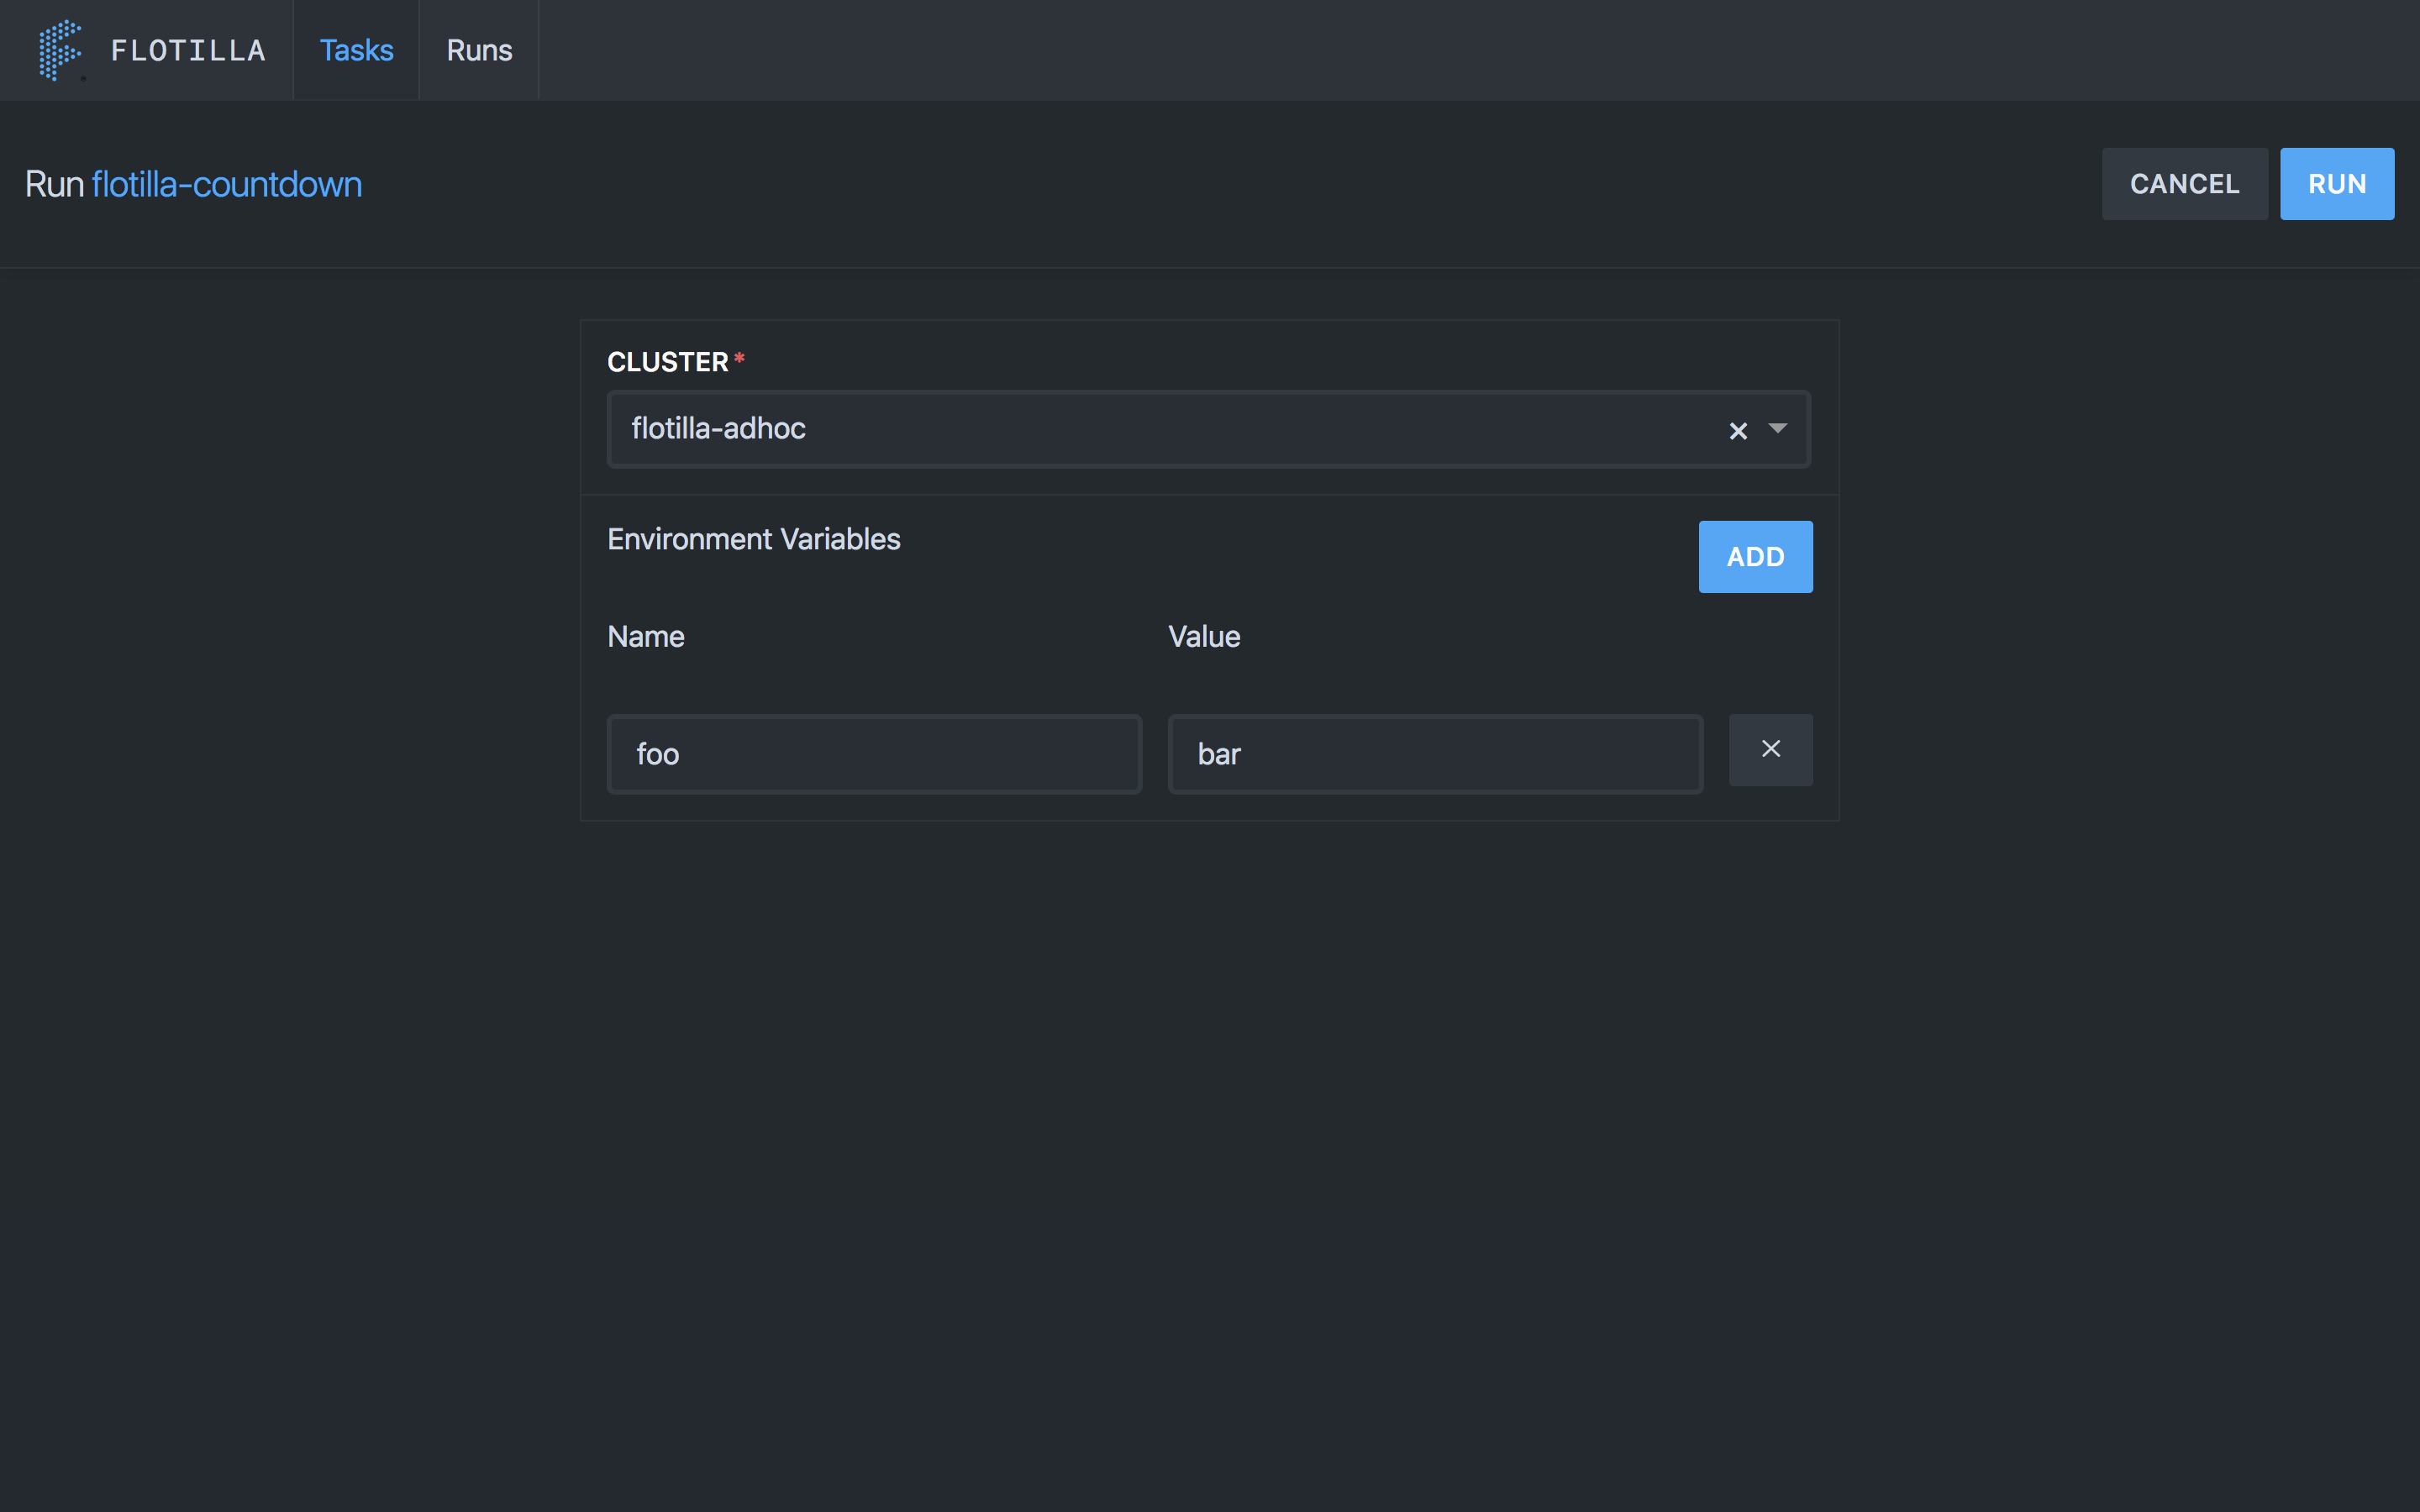
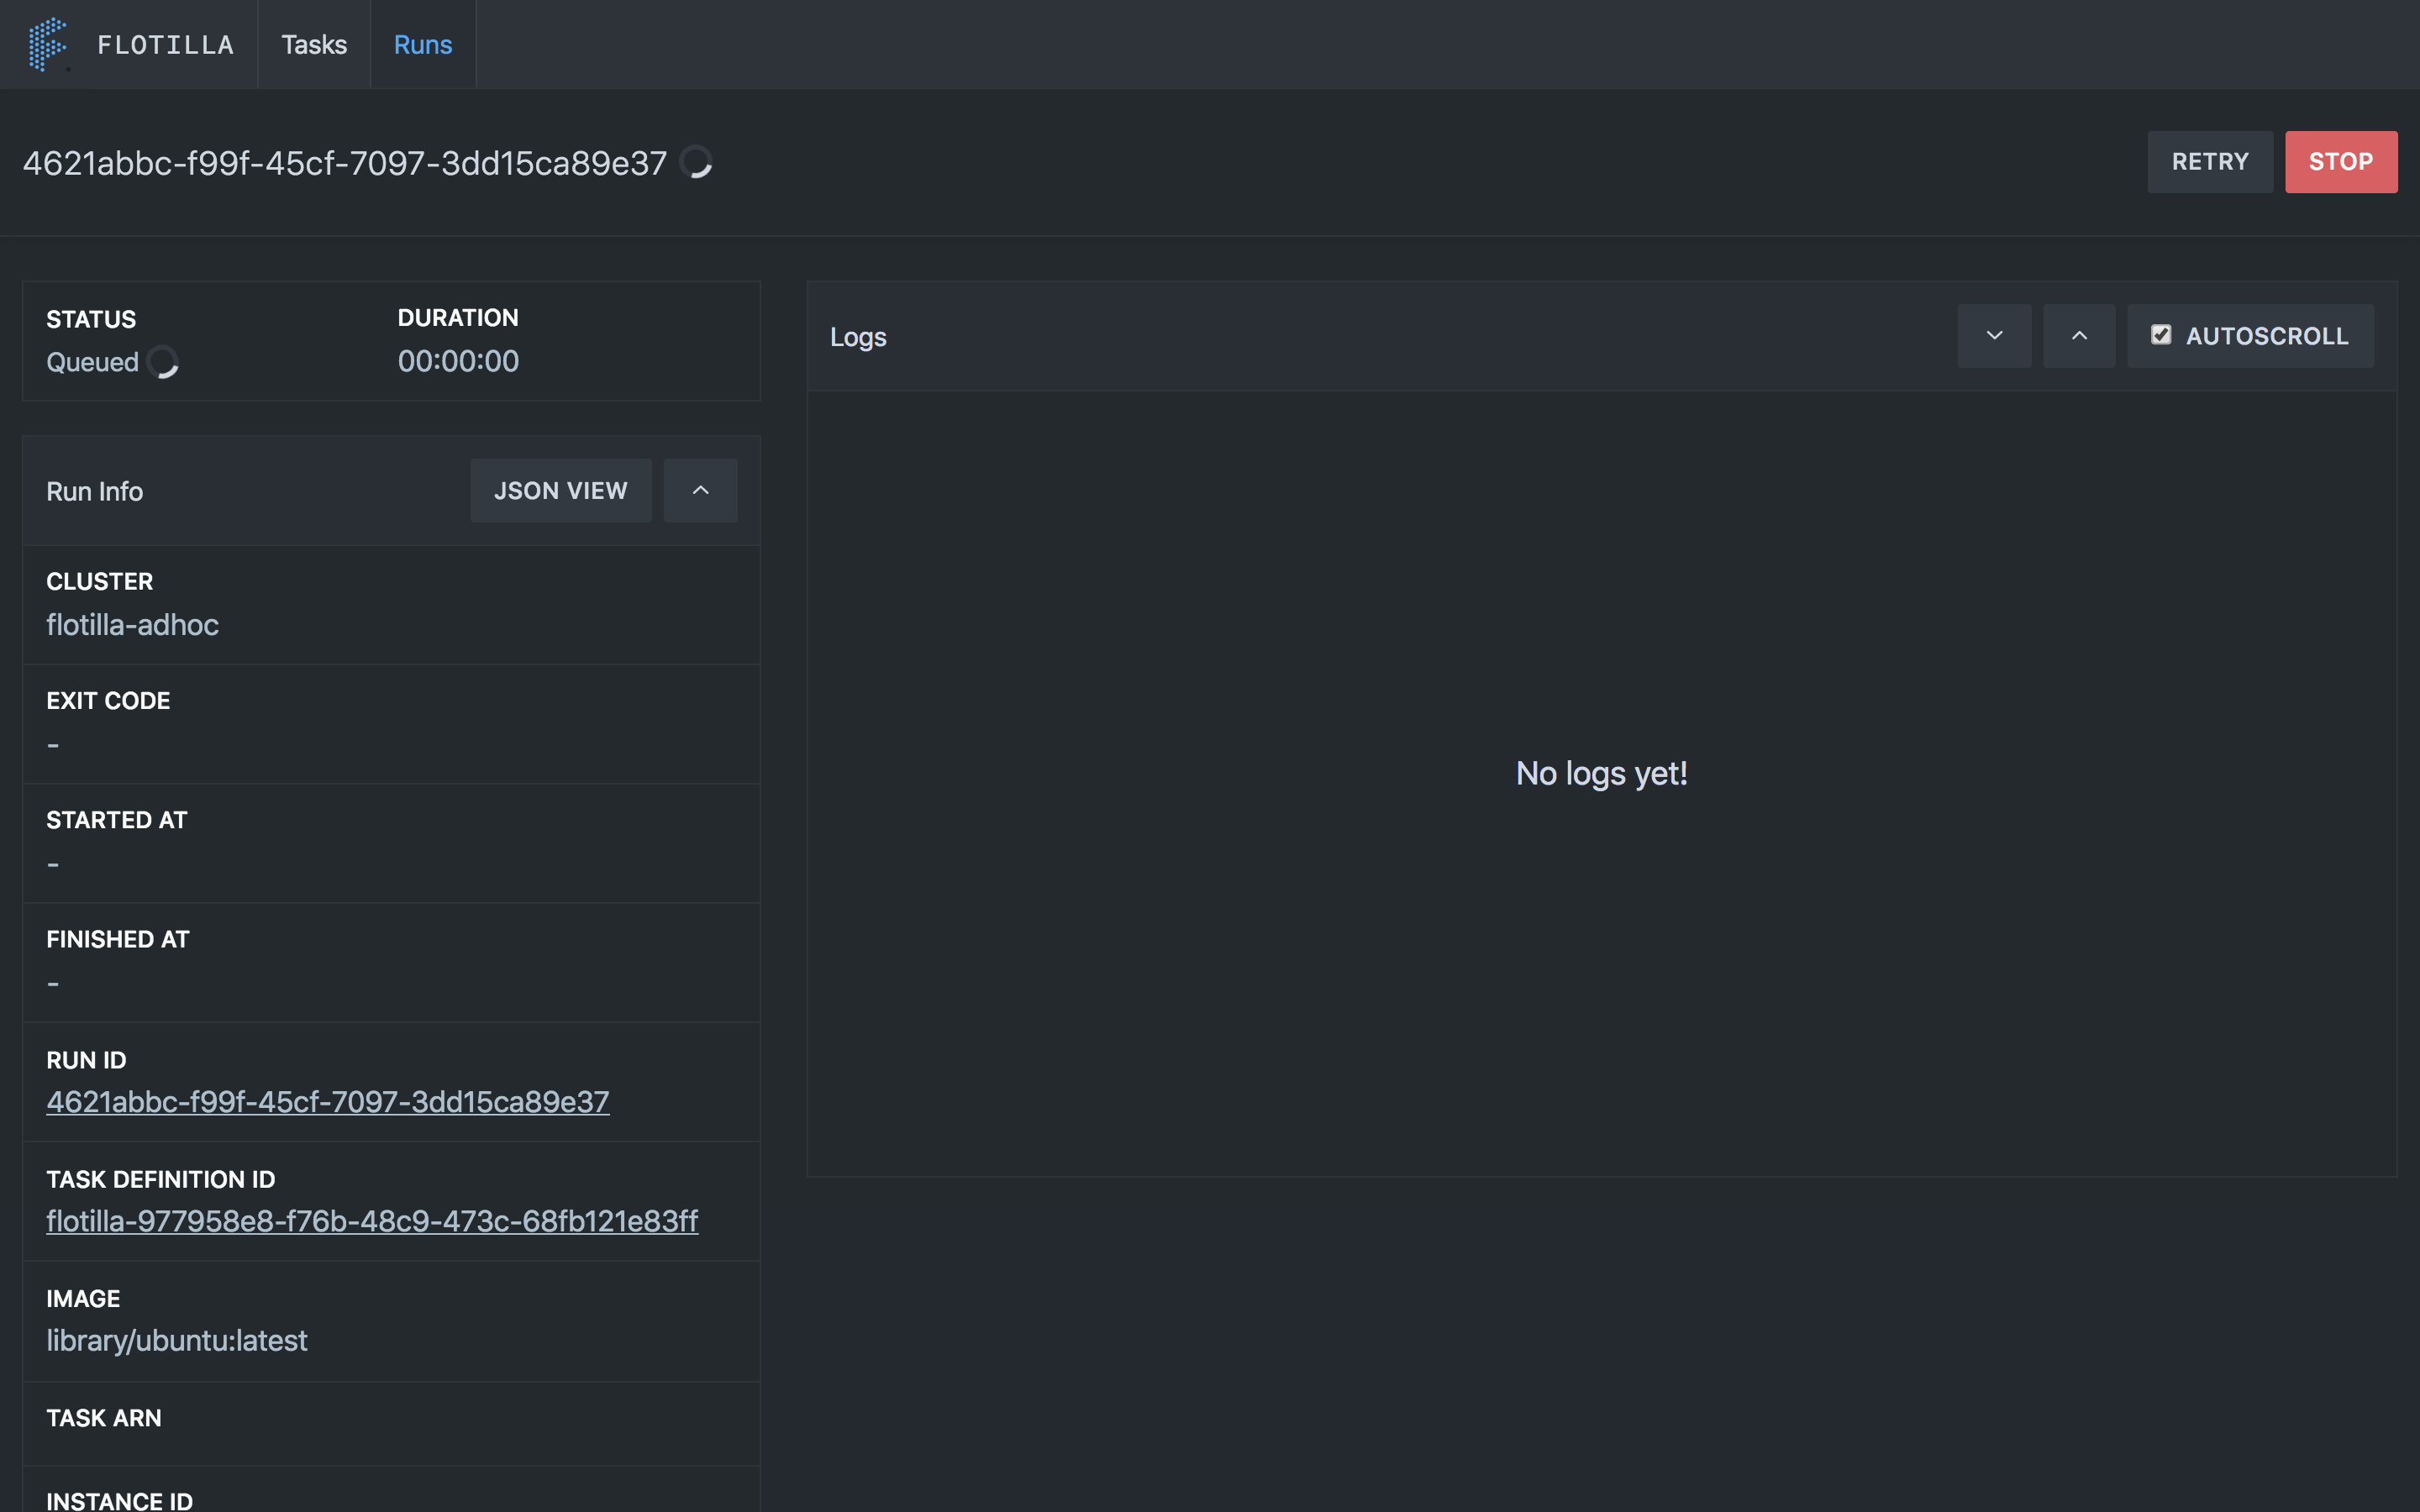
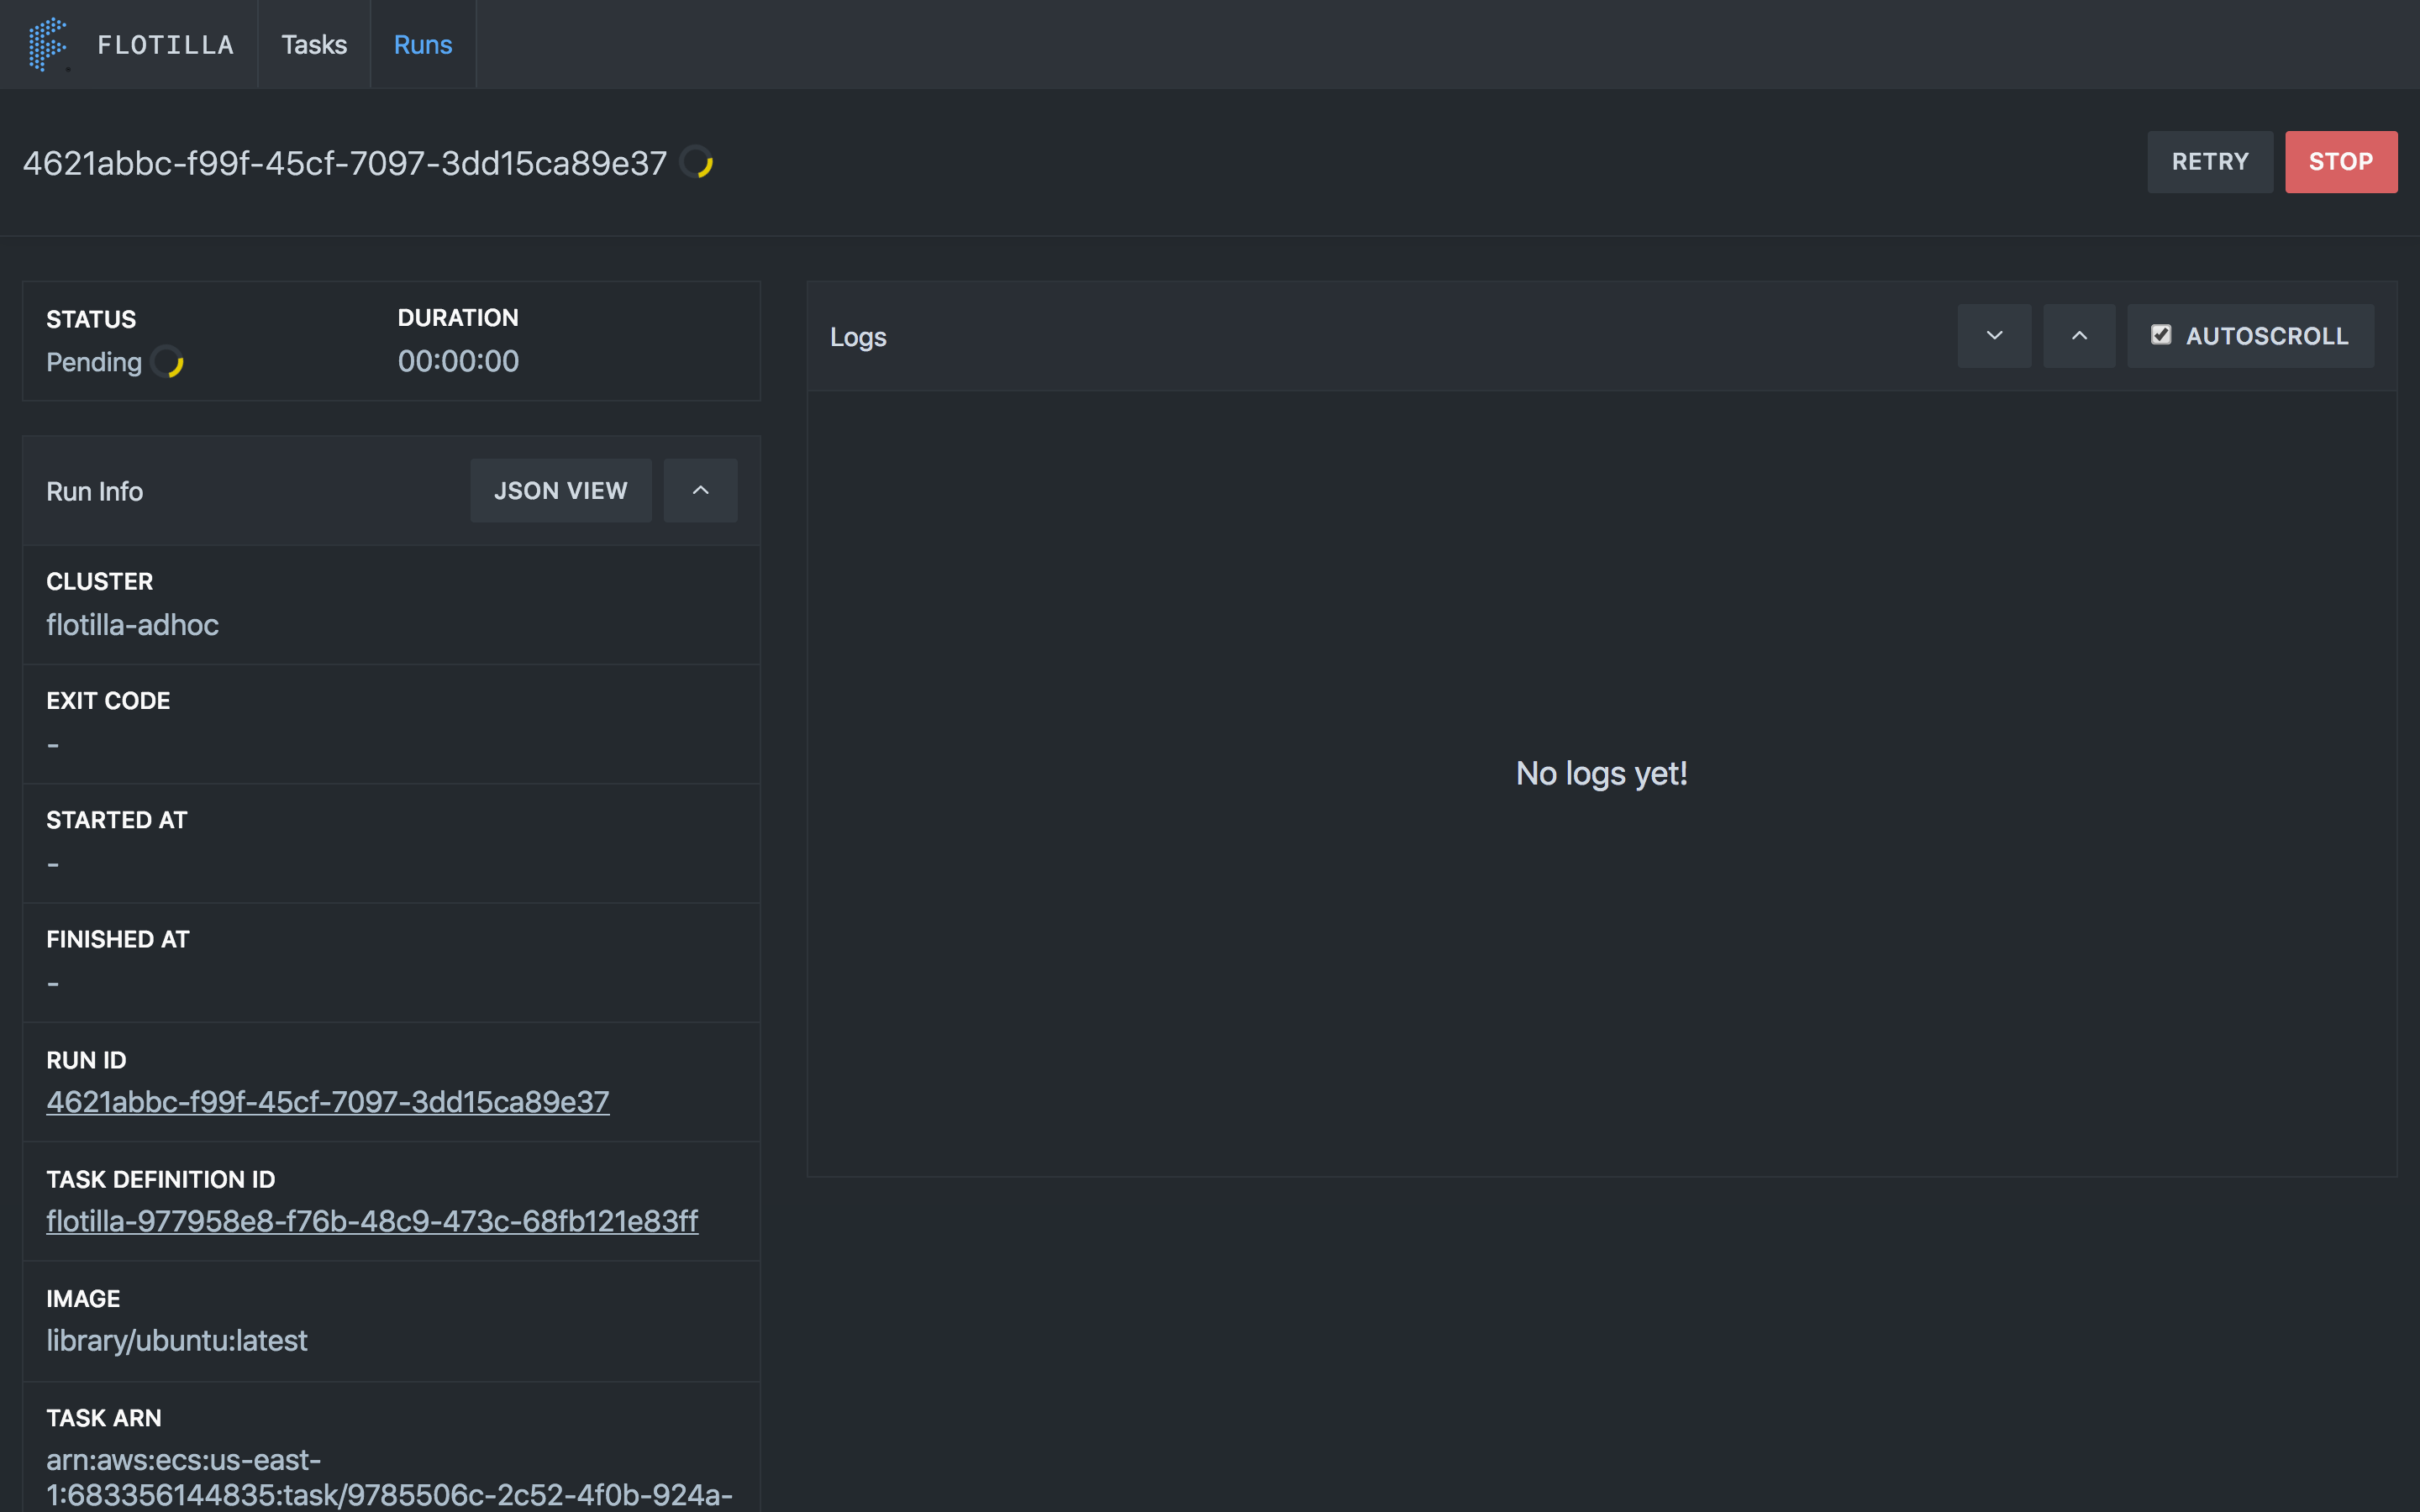
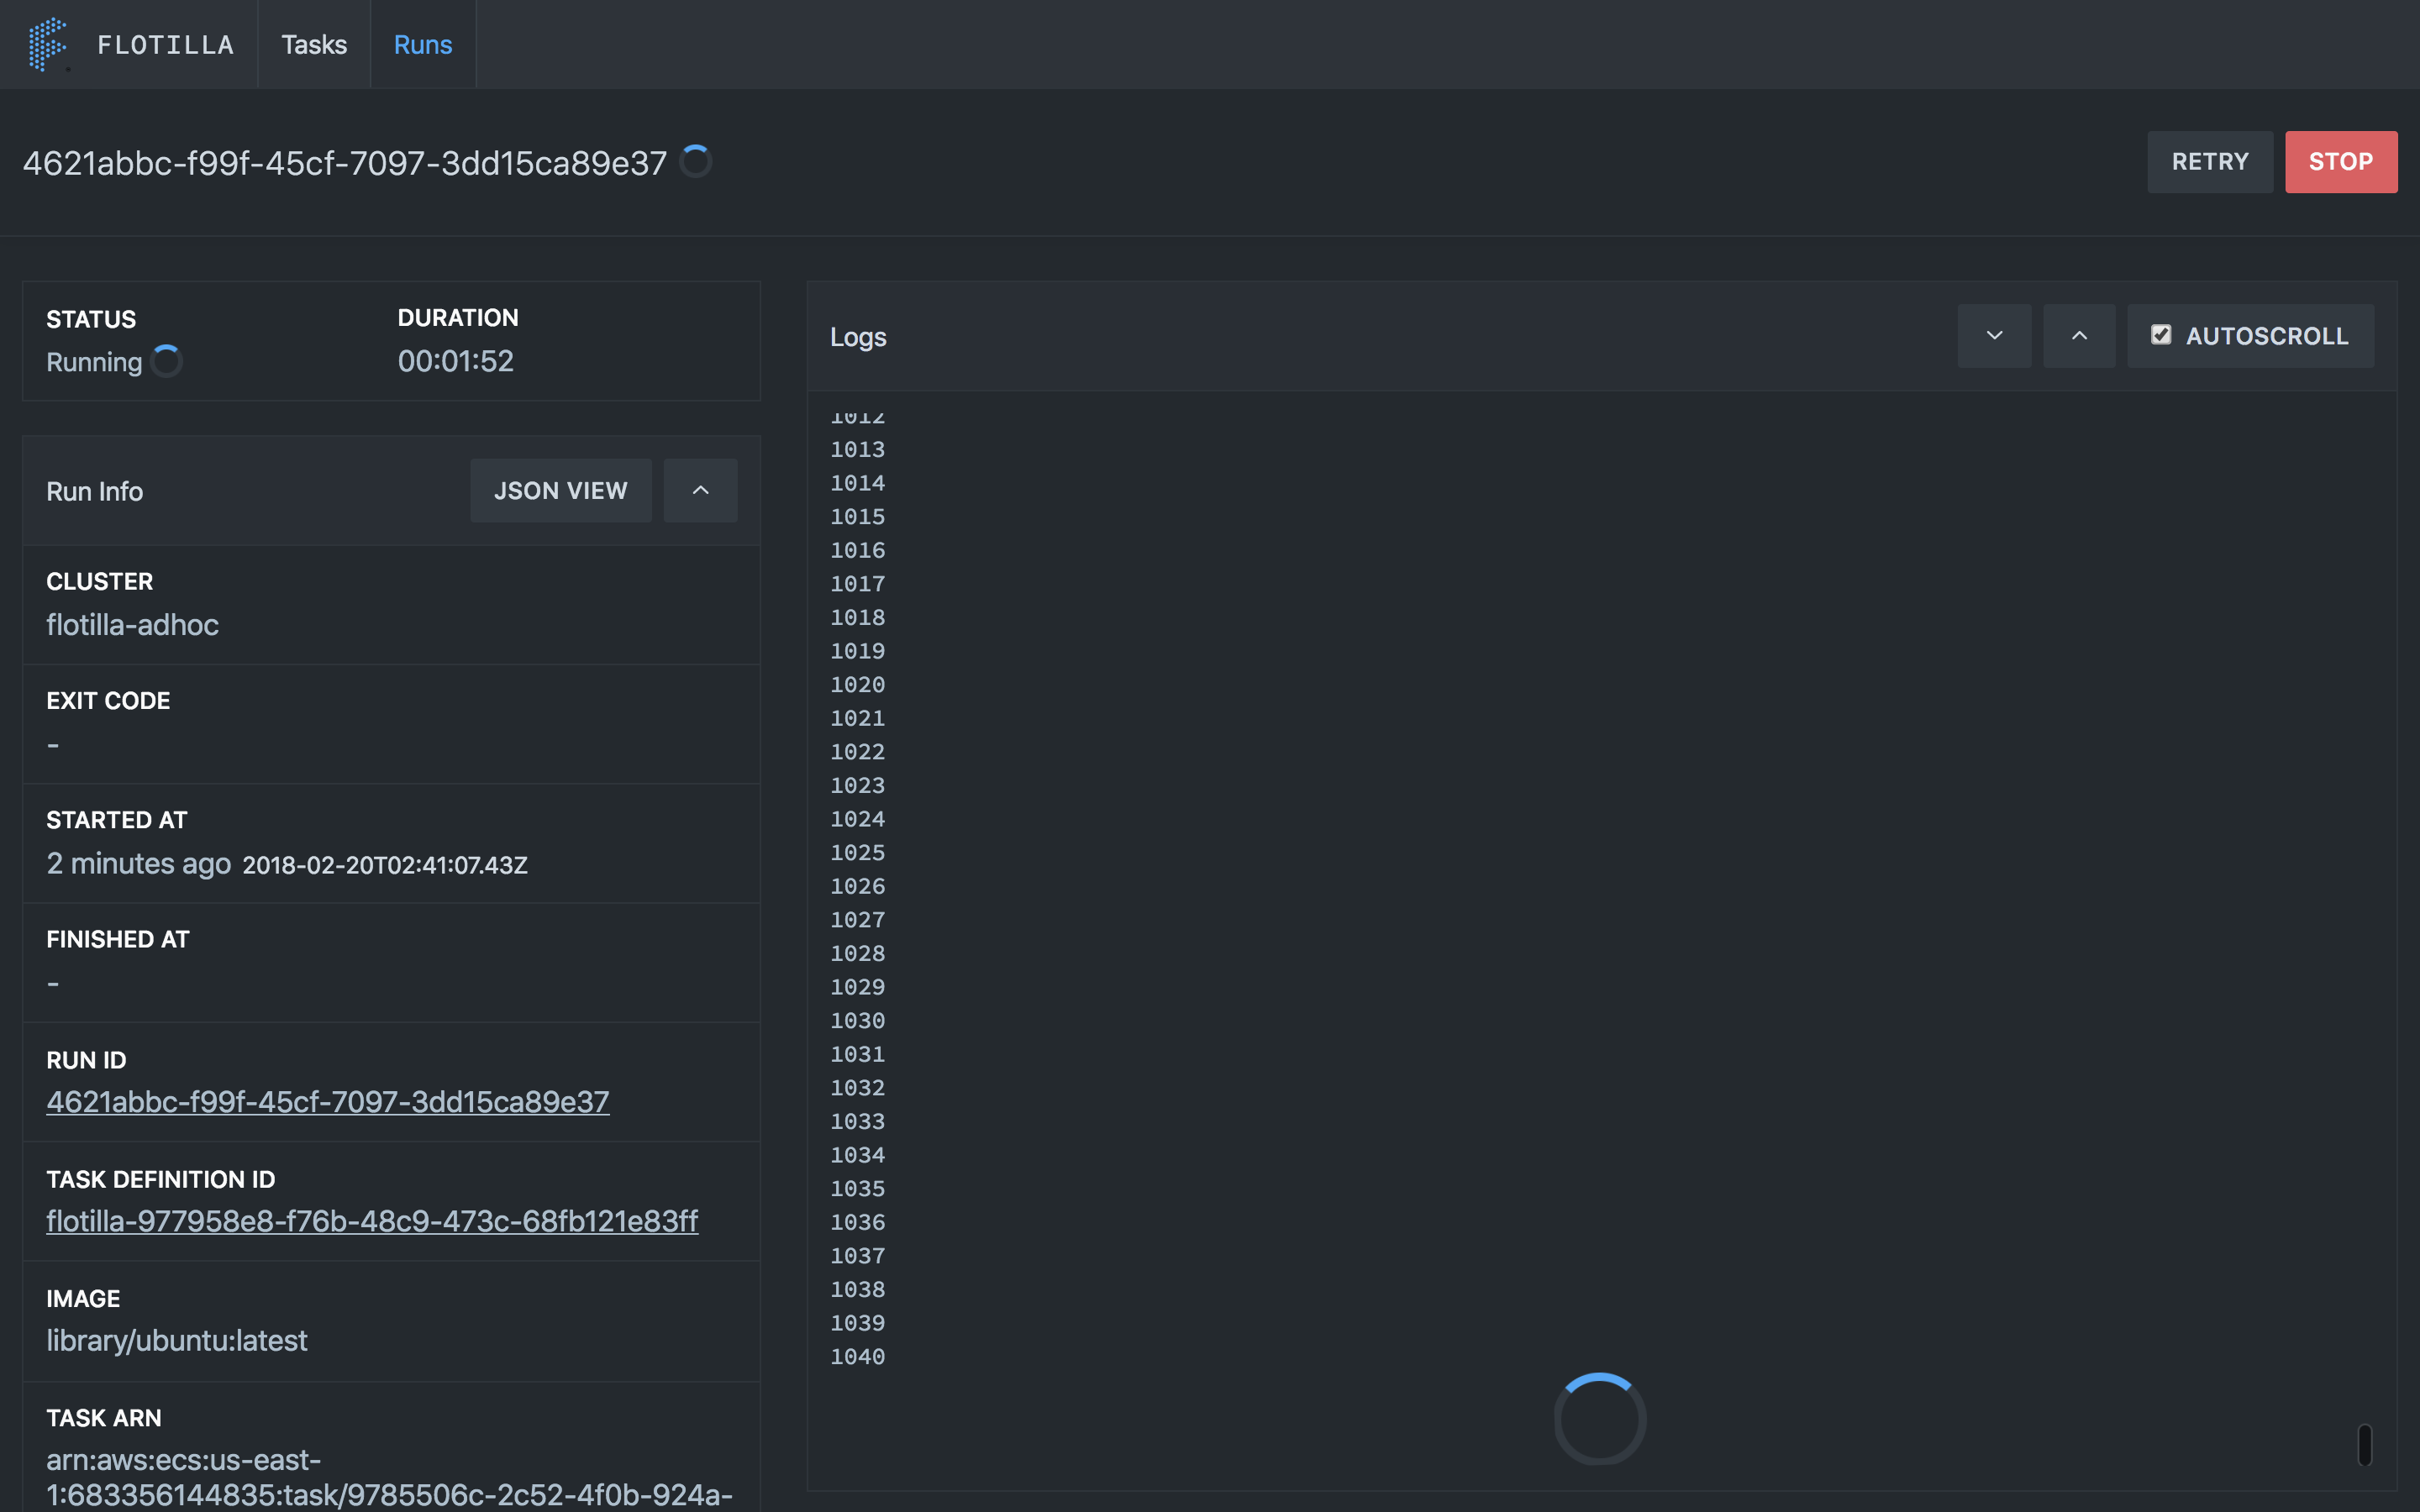
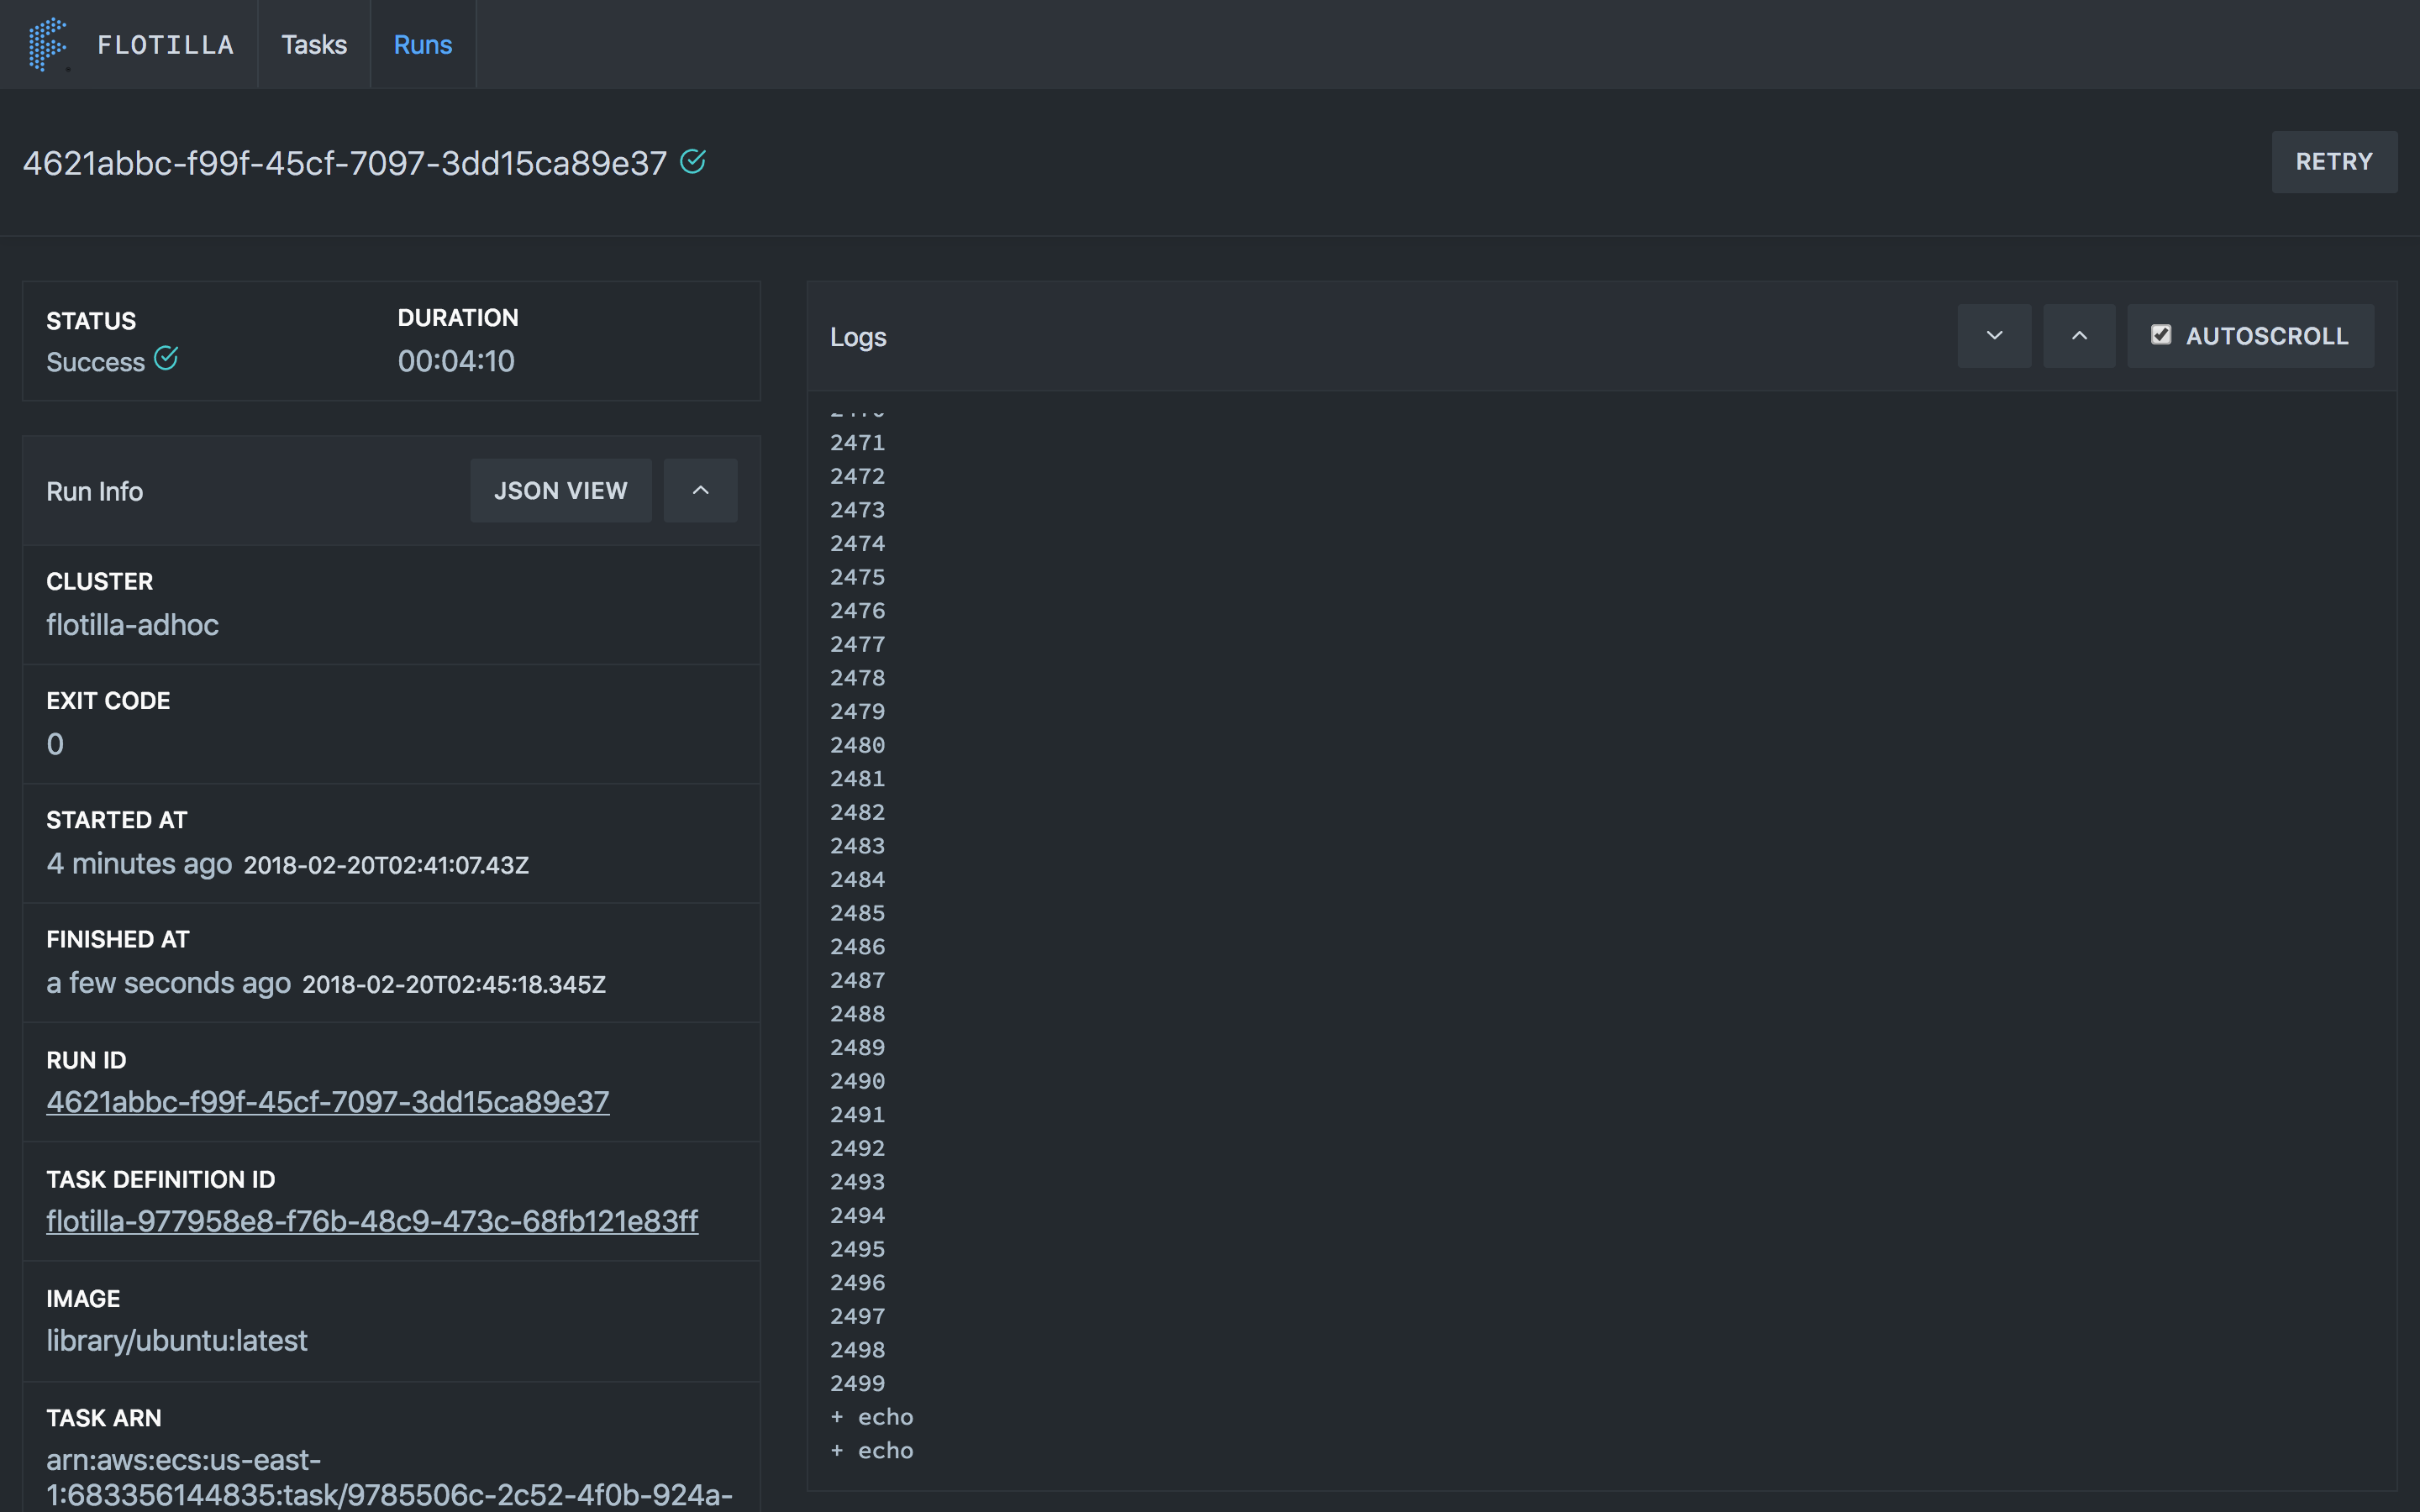
Flotilla has a simple, easy to use UI. Here's some example images for basic usage.
The UI allows you to quickly create new tasks.
You can run tasks you've created with the UI as well. Once you've ran a task the run will transition from Queued to Pending to Running before it finishes and shows Success or Failed (see Task Life Cycle). Once a task is in the Running state the logs should be visible.
Before you can run a task you first need to define it. We'll use the example hello world task definition. Here's what that looks like:
hello-world.json
{
  "alias": "hello-flotilla",
  "group_name": "examples",
  "image": "ubuntu:latest",
  "memory": 512,
  "env": [
    {
      "name": "USERNAME",
      "value": "_fill_me_in_"
    }
  ],
  "command": "echo \"hello ${USERNAME}\""
}
It's a simple task that runs in the default ubuntu image, prints your username to the logs, and exits.
Note: While you can use non-public images and images in your own registries with flotilla, credentials for accessing those images must exist on the EKS hosts. This is outside the scope of this doc.
Let's define it:
curl -XPOST localhost:5000/api/v6/task --data @examples/hello-world.json
You'll notice that if you visit the initial url again http://localhost:5000/api/v6/task the newly defined definition will be in the list.
This is the fun part. You'll make a PUT request to the execution endpoint for the task you just defined and specify any environment variables.
curl -XPUT localhost:5000/api/v6/task/alias/hello-flotilla/execute -d '{
  "cluster":"default",
  "env":[
    {"name":"USERNAME","value":"yourusername"}
  ],
  "run_tags":{"owner_id":"youruser"}
}'
Note:
run_tagsis defined as a way for all runs to have a ownership injected for visibility and is required.
You'll get a response that contains a run_id field. You can check the status of your task at http://localhost:5000/api/v6/history/<run_id>
curl -XGET localhost:5000/api/v6/history/<run_id>

{
  "instance": {
    "dns_name": "<dns-host-of-task-node>",
    "instance_id": "<instance-id-of-task-node>"
  },
  "run_id": "<run_id>",
  "definition_id": "<definition_id>",
  "alias": "hello-flotilla",
  "image": "ubuntu:latest",
  "cluster": "default",
  "status": "PENDING",
  "env": [
    {
      "name": "FLOTILLA_RUN_OWNER_ID",
      "value": "youruser"
    },
    {
      "name": "FLOTILLA_SERVER_MODE",
      "value": "dev"
    },
    {
      "name": "FLOTILLA_RUN_ID",
      "value": "<run_id>"
    },
    {
      "name": "USERNAME",
      "value": "yourusername"
    }
  ]
}
and you can get the logs for your task at http://localhost:5000/api/v6/<run_id>/logs. You will not see any logs until your task is at least in the RUNNING state.
curl -XGET localhost:5000/api/v6/<run_id>/logs

{
  "last_seen":"<last_seen_token_used_for_paging>",
  "log":"+ set -e\n+ echo 'hello yourusername'\nhello yourusername"
}
| Name | Definition |
|---|---|
task |
A definition of a task that can be executed to create a run |
run |
An instance of a task |
When executed, a task's run goes through several transitions
QUEUED- this is the first phase of a run and means the run is currently queued and waiting to be allocated to a clusterPENDING- everyworker.submit_interval(defined in the config) the submit worker pulls from the queues and submits them for execution. At this point, if the cluster associated with the run has resources, the run gets allocated to the cluster and transitions to thePENDINGstatus. For the default execution engine this stage encapsulates the process of pulling the docker image and starting the container. It can take several minutes depending on whether the image is cached and how large the image is.RUNNING- Once the run starts on a particular execution host it transitions to this stage. At this point logs should become available.STOPPED- A run enters this stage when it finishes execution. This can mean it either succeeded or failed depending on the existence of anexit_codeand the value of that exit code.NEEDS_RETRY- on occassion, due to host level characteristics (full disk, too many open files, timeouts pulling image, etc) the run exits with a null exit code without ever being executed. In this case the reason is analyzed to determine if the run is retriable. If it is, the task transitions to this status and is allocated to the appropriate execution queue again, and will repeat the lifecycle.
QUEUED --> PENDING --> RUNNING --> STOPPED
... --> PENDING --> STOPPED --> NEEDS_RETRY --> QUEUED --> ...
In a production deployment you'll want multiple instances of the flotilla service running and postgres running elsewhere (eg. Amazon RDS). In this case the most salient detail configuration detail is the DATABASE_URL.
The simplest way to deploy for very light usage is to avoid a reverse proxy and deploy directly with docker.
-
Build and tag an image for flotilla using the
Dockerfileprovided in this repo:docker build -t <your repo name>/flotilla:<version tag> -
Run this image wherever you deploy your services:
docker run -e DATABASE_URL=<your db url> -e FLOTILLA_MODE=prod -p 3000:3000 ...<other standard docker run args>See docker run for more details
The variables in conf/config.yml are sensible defaults. Most should be left alone unless you're developing flotilla itself. However, there are a few you may want to change in a production environment.
| Variable Name | Description |
|---|---|
worker_retry_interval |
Run frequency of the retry worker |
worker_submit_interval |
Poll frequency of the submit worker |
worker_status_interval |
Poll frequency of the status update worker |
http_server_read_timeout_seconds |
Sets read timeout in seconds for the http server |
http_server_write_timeout_seconds |
Sets the write timeout in seconds for the http server |
http_server_listen_address |
The port for the http server to listen on |
owner_id_var |
Which environment variable containing ownership information to inject into the runtime of jobs |
enabled_workers |
This variable is a list of the workers that run. Use this to control what workers run when using a multi-container deployment strategy. Valid list items include (retry, submit, and status) |
metrics_dogstatsd_address |
Statds metrics host in Datadog format |
metrics_dogstatsd_namespace |
Namespace for the metrics - for example flotilla. |
redis_address |
Redis host for caching and locks |
redis_db |
Redis db to be used - numeric |
eks_clusters |
hash-map of cluster-name and it's associated kubeconfig (encoded in base64) |
eks_kubeconfig_basepath |
folder where the kubeconfigs are stored |
eks_cluster_ondemand_whitelist |
override list of cluster names where to force ondemand node types |
eks_cluster_override |
EKS clusters to override traffic |
eks_scheduler_name |
Custom scheduler name to use, default is kube-scheduler |
eks_manifest_storage.options.region |
Kubernetes manifest s3 upload bucket aws region |
eks_manifest_storage_options_s3_bucket_name |
S3 bucket name for manifest storage. |
eks_manifest_storage_options_s3_bucket_root_dir |
S3 root bucket path. |
eks_log_namespace_retention_days |
Number of days to store logs. |
eks_log_namespace_driver_name |
Logger name. |
eks_log_namespace_driver_options_s3_bucket_name |
S3 bucket name to store logs. |
eks_log_namespace_driver_options_s3_bucket_root_dir |
S3 root bucket path within the bucket. |
eks_job_namespace |
Kubernetes namespace to submit jobs to. |
eks_job_ttl |
default job ttl in seconds |
eks_job_queue |
SQS job queue - the api places the jobs on this queue and the submit worker asynchronously submits it to Kubernetes/EKS |
eks.service_account |
Kubernetes service account to use for jobs. |
See API
Currently Flotilla is built using go 1.9.3 and uses the go mod to manage dependencies.
go get && go build

