-
Notifications
You must be signed in to change notification settings - Fork 37
Setup Kubernetes logging environment
When running multiple services and applications on a Kubernetes cluster, a centralized, cluster-level logging stack can help you quickly sort through and analyze the heavy volume of log data produced by your Pods. we choosed the one popular centralized logging solution is the Elasticsearch, Fluentd, and Kibana (EFK) stack.
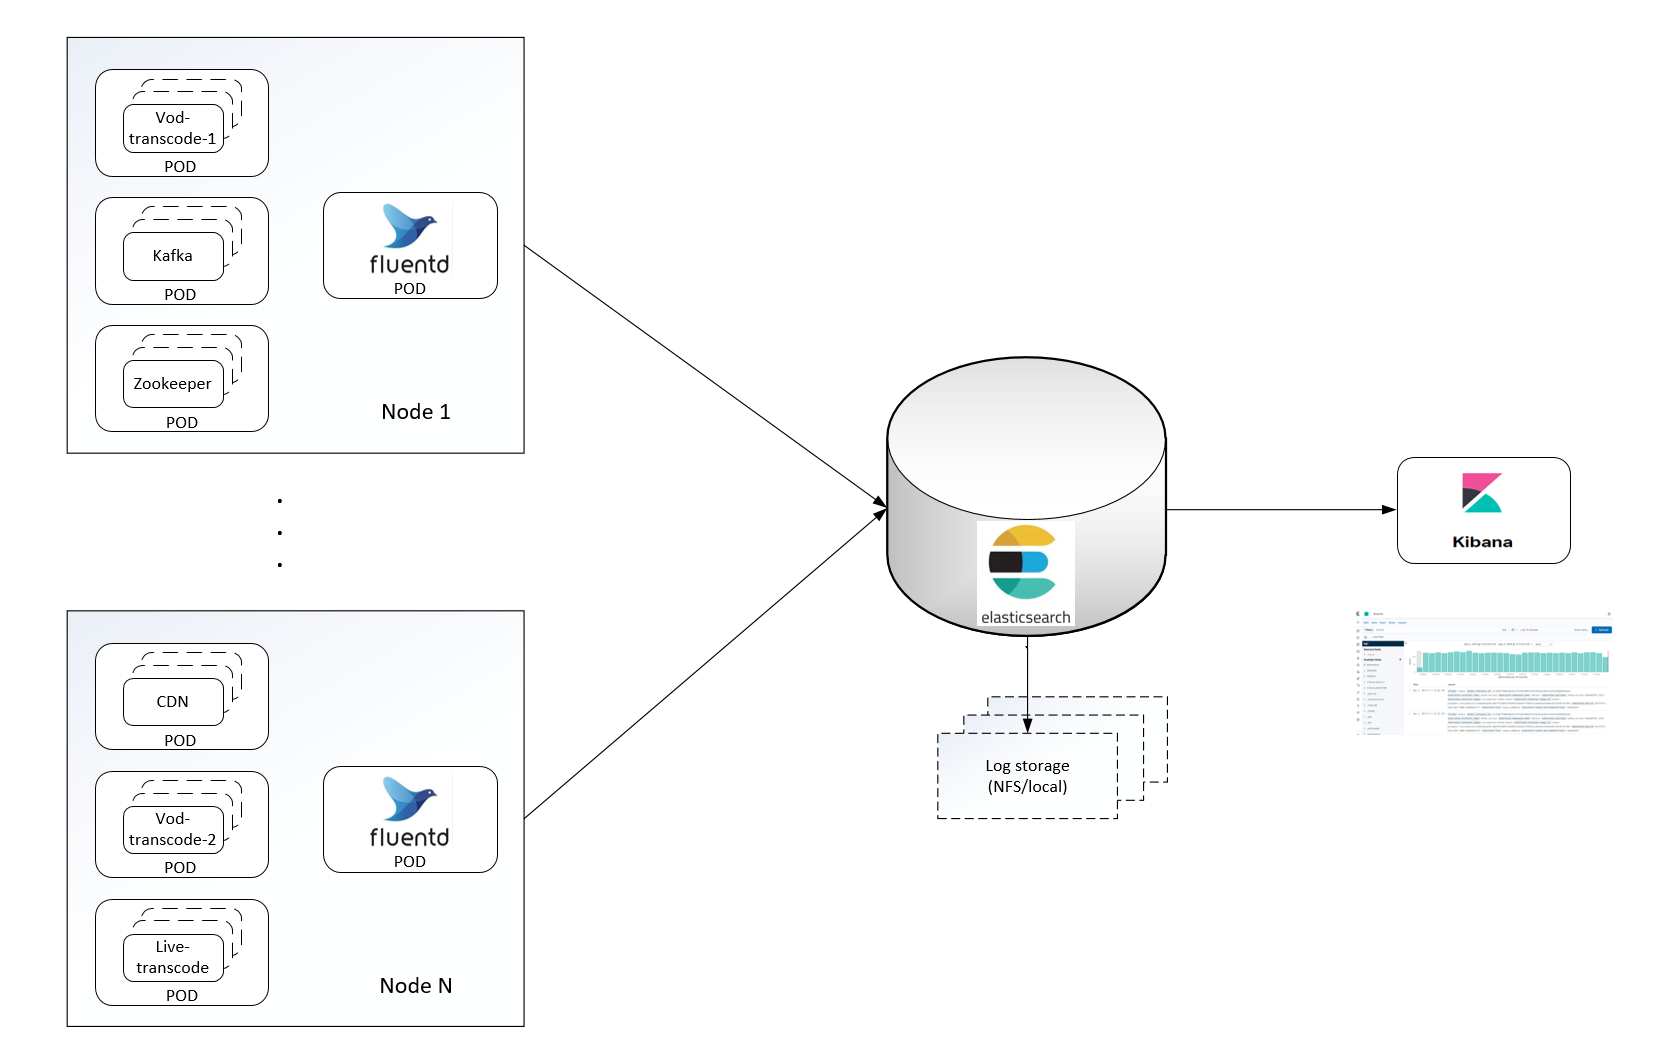
- Elasticsearch: Elasticsearch is a distributed, RESTful search and analytics engine. In the EFK stack, we use Elasticsearch to store and search the logs forwarded by Fluentd.
- Fluentd: Fluentd is an open source data collector, which lets you unify the data collection. it can be run directly on the host, or in a Docker container. Here we will use a DaemonSet to ensure that Fluentd is running on every node.
- Kibana: Once you have some logs into Elasticsearch, we can add a tool for exploring and analyze them like Kibana.Kibana lets you visualize your Elasticsearch data and navigate the Elastic Stack.
On Kubernetes master node, run below command to start Kubernetes logging:
$ cd deployment/kubernetes/logging
$ ./start_logging.shNote: This script must be run as root
Visit https://<CDN-Transcode Server IP address>:5601 in your web browser. You should see Kibana login page:
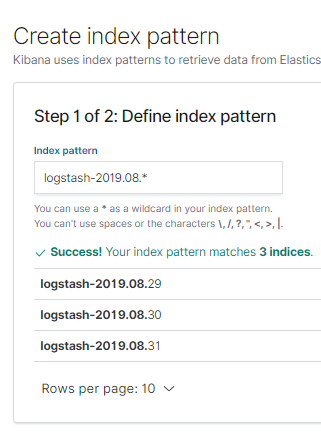
In the left-hand navigation bar, select the Management button, then click on Index patterns button, start to define index pattern.


In the left-hand navigation bar, select the Discover button, see the logs.
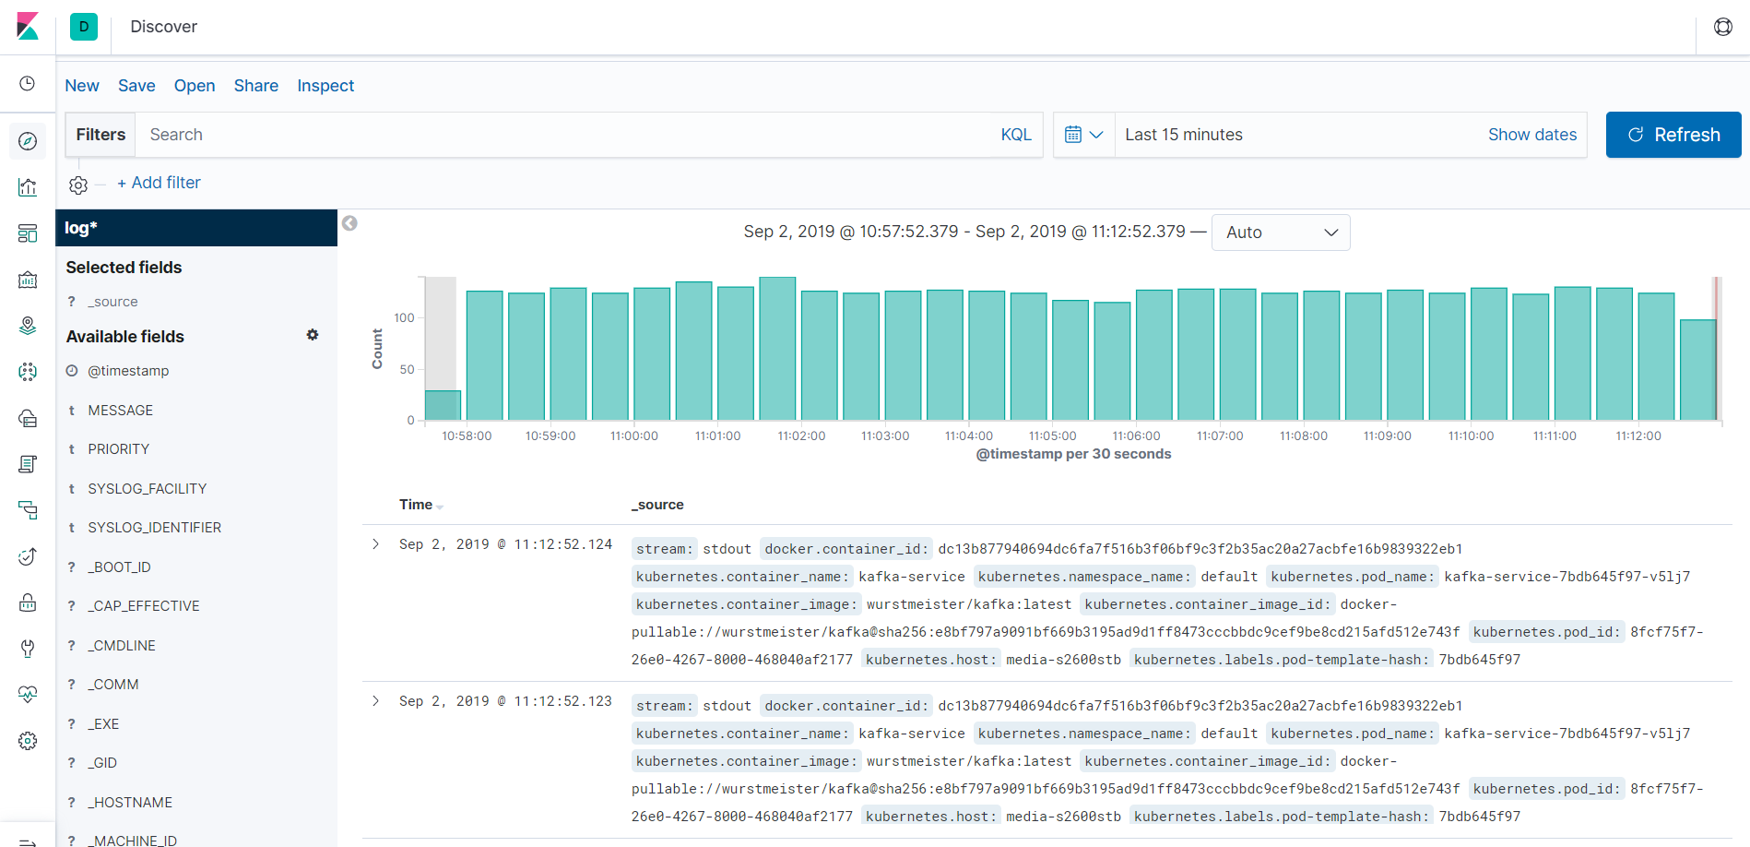
Select the Filters button, input "kubernetes.pod_name : live-transcode-service-xxxx", click on "Update" to filter logs of "live-transcode-service-xxxx" pod.

You can check the detailed log from the filtered log list.
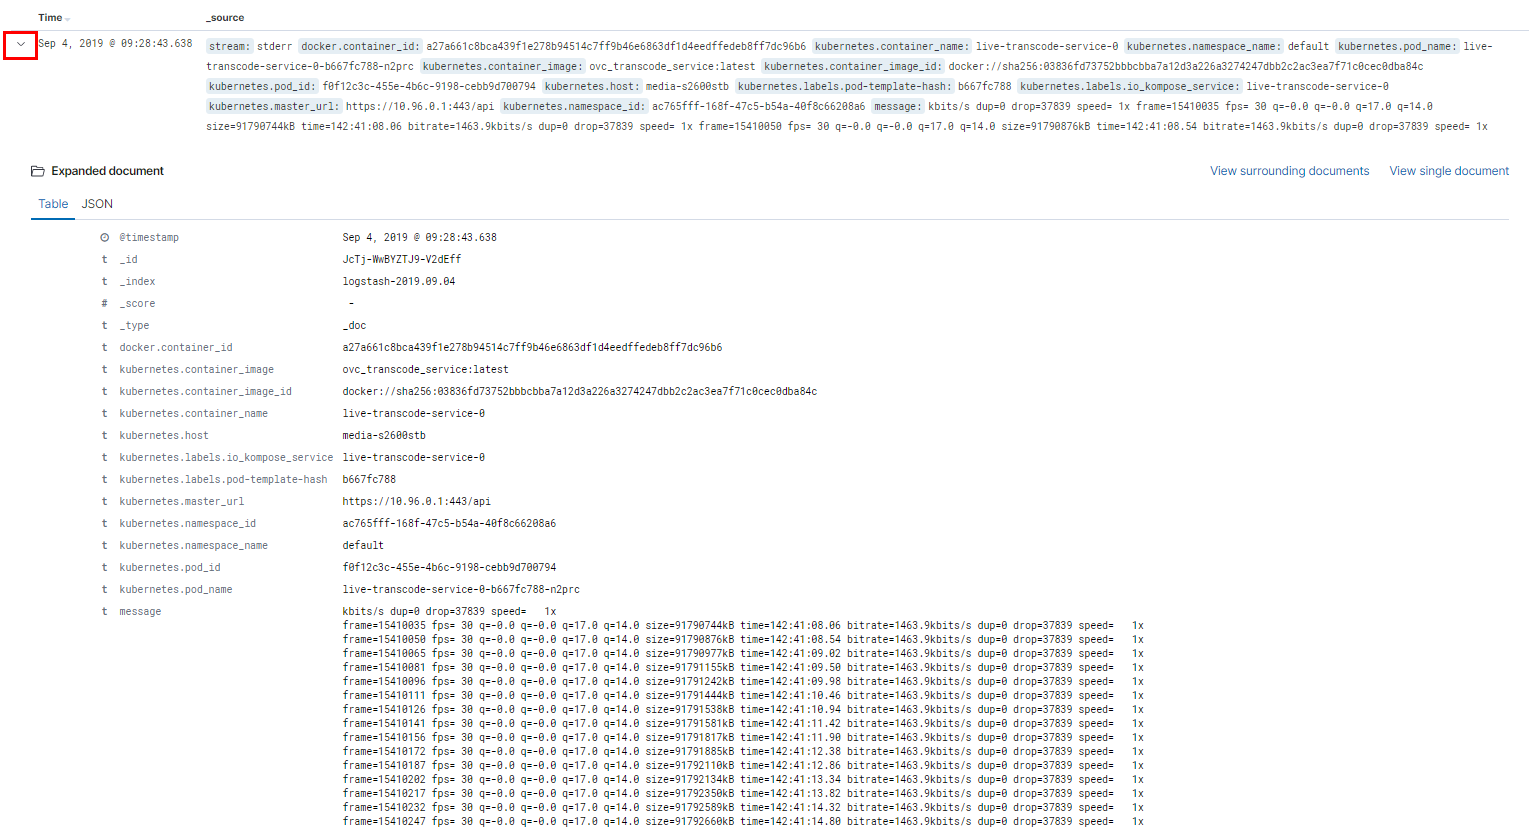
On discover page, click on "Save" button to save log and choose "Share" button to create report.

You can download log from Management --> Kibana --> Reporting

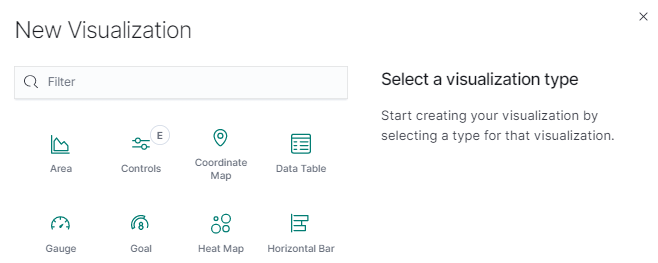
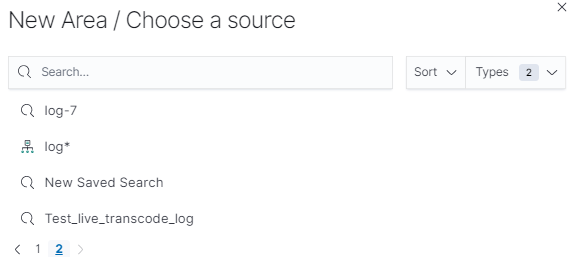
In the left-hand navigation bar, select the Visualize button, start to create your customized visualization. Click on "Area", choose a source, configure the coordinate axis parameters and run it.

Powered by Open Visual Cloud media software stack.
- Setup proxy server
- Setup Kubernetes for CentOS
- Setup Kubernetes for Ubuntu
- Setup NFS environment
- Setup Kubernetes Logging
- Setup Kubernetes Monitoring