-
Notifications
You must be signed in to change notification settings - Fork 37
Setup Kubernetes monitoring environment
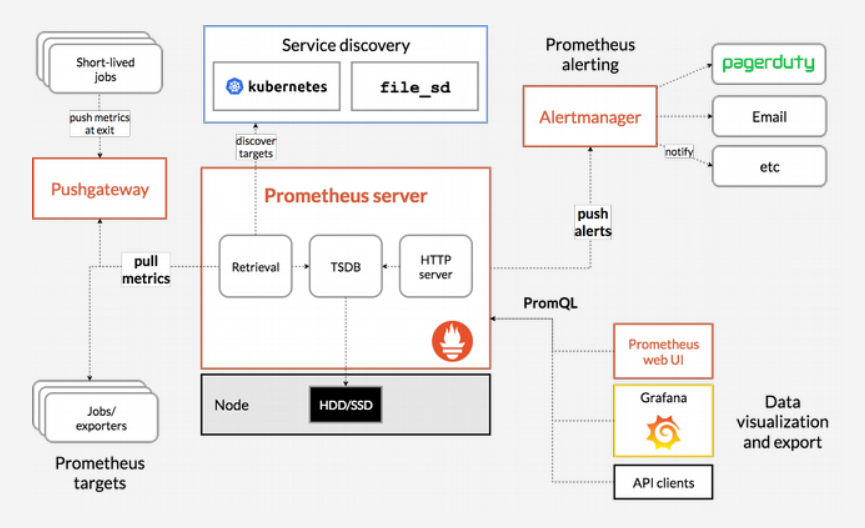
Along with tracing and logging, monitoring and alerting are essential components of a Kubernetes observability stack. Setting up monitoring for your Kubernetes cluster allows you to track your resource usage and analyze and debug application errors. we choosed the one popular monitoring solution is the open-source Prometheus, Grafana, and Alertmanager stack, deployed alongside kube-state-metrics and node_exporter to expose cluster-level Kubernetes object metrics as well as machine-level metrics like CPU and memory usage.

- Prometheus: Prometheus is a time series database and monitoring tool that works by polling metrics endpoints and scraping and processing the data exposed by these endpoints. It allows you to query this data using PromQL, a time series data query language. In addition, a preconfigured set of Prometheus Alerts, Rules, and Jobs will be stored as a ConfigMap.
- Alertmanager: Alertmanager usually deployed alongside Prometheus, forms the alerting layer of the stack, handling alerts generated by Prometheus and deduplicating, grouping, and routing them to integrations like email or PagerDuty.
- Grafana: Grafana is a data visualization and analytics tool that allows you to build dashboards and graphs for your metrics data.
- kube-state-metrics: kube-state-metrics is an add-on agent that listens to the Kubernetes API server and generates metrics about the state of Kubernetes objects like Deployments and Pods. These metrics are served as plaintext on HTTP endpoints and consumed by Prometheus.
- node-exporter: a Prometheus exporter that runs on cluster nodes and provides OS and hardware metrics like CPU and memory usage to Prometheus. These metrics are also served as plaintext on HTTP endpoints and consumed by Prometheus.
On Kubernetes master node, run below command to start Kubernetes monitoring:
$ cd deployment/kubernetes/monitoring
$ ./start_monitoring.shNote: This script must be run as root
Visit http://<CDN-Transcode Server IP address>:30001 in your web browser. You should see the following Grafana login page:

To log in, use the default username/password admin/admin (if you haven’t modified the admin-user parameter).

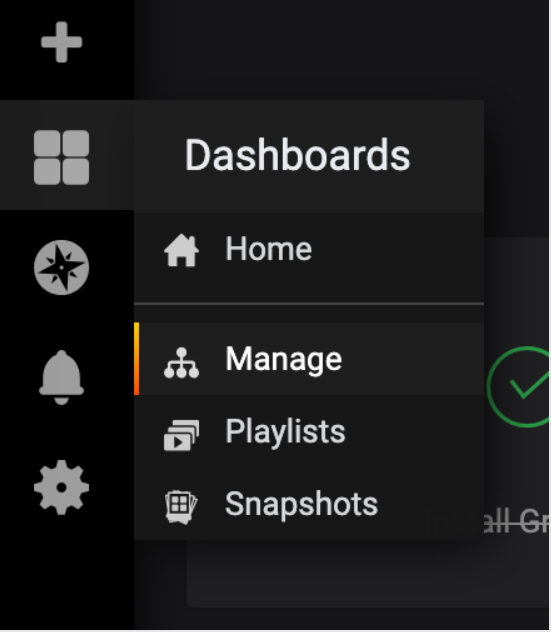
In the left-hand navigation bar, select the Dashboards button, then click on Manage:

You’ll be brought to the following dashboard management interface, which lists the dashboards configured in the grafana-configMapDashboardDefinitions.yaml manifest:

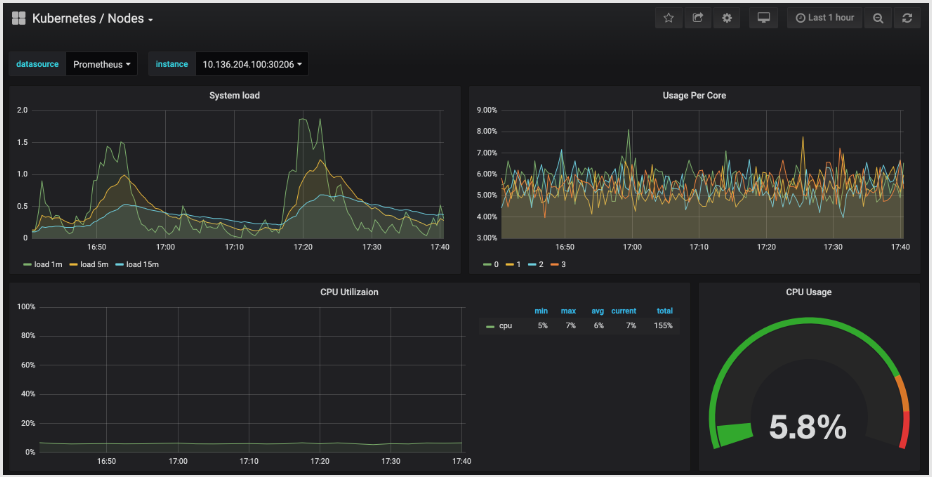
Click in to the Kubernetes / Nodes dashboard, which visualizes CPU, memory, disk, and network usage for a given node:

Visit http://<CDN-Transcode Server IP address>:30002 in your web browser. You should see the following Prometheus Graph page:

From here you can use PromQL, the Prometheus query language, to select and aggregate time series metrics stored in its database.
In the Expression field, type kubelet_node_name and hit Execute. You should see a list of time series with the metric kubelet_node_name that reports the Nodes in your Kubernetes cluster. You can see which node generated the metric and which job scraped the metric in the metric labels:

Finally, in the top navigation bar, click on Status and then Targets to see the list of targets Prometheus has been configured to scrape.
To connect to Alertmanager, which manages Alerts generated by Prometheus, we’ll follow a similar process to what we used to connect to Prometheus. . In general, you can explore Alertmanager Alerts by clicking into Alerts in the Prometheus top navigation bar.
Visit http://<CDN-Transcode Server IP address>:30004 in your web browser. You should see the following Alertmanager Alerts page:

Powered by Open Visual Cloud media software stack.
- Setup proxy server
- Setup Kubernetes for CentOS
- Setup Kubernetes for Ubuntu
- Setup NFS environment
- Setup Kubernetes Logging
- Setup Kubernetes Monitoring