Adding New Visualisations
This page will cover adding a new Visualisation Style plugin, to keep things simple we will be adding a new chart
type using the Billboard.js chart library that comes packaged with DVF. That
said, your custom visualisation style can leverage any front end library you like.
For a Visualisation style plugin to be registered, the following needs to be done at a minimum:
- A PHP class that extends
Drupal\dvf\Plugin\Visualisation\Style\VisualisationStyleBaseexists in the following directoryMY_MODULE/src/Plugin/Visualisaion/Style/ - The class must implement
Drupal\dvf\Plugin\Visualisation\VisualisationStyleInterface - The class comments contain the appropriate annotations for
@VisualisationStyle
Example
namespace Drupal\my_module\Plugin\Visualisation\Style;

use Drupal\dvf\Plugin\Visualisation\Style\VisualisationStyleBase;
use Drupal\dvf\Plugin\Visualisation\VisualisationStyleInterface;

/**
 * Plugin implementation of the 'my_module_awesome_style' visualisation style.
 *
 * @VisualisationStyle(
 *   id = "my_module_awesome_chart",
 *   label = @Translation("Awesome chart")
 * )
 */
class AwesomeChart extends VisualisationStyleBase implements VisualisationStyleInterface {
  ...
}
This should be enough for it to appear under "Visualisation style" on a DVF field (clear cache first).
Your visualisation will most likely need some settings, so you need to define defaults, add a settings form and finally pass those settings off to the frontend. This is done with the following methods
-
public function defaultConfiguration()Defines default settings, eg when creating a new visualisation. -
public function settingsForm(array $form, FormStateInterface $form_state)Defines the settings form that is displayed to the user when your visualisation style is selected. -
public function chartBuildSettings(array $records)Adds additional settings that are passed to the frontend viadrupalSettings
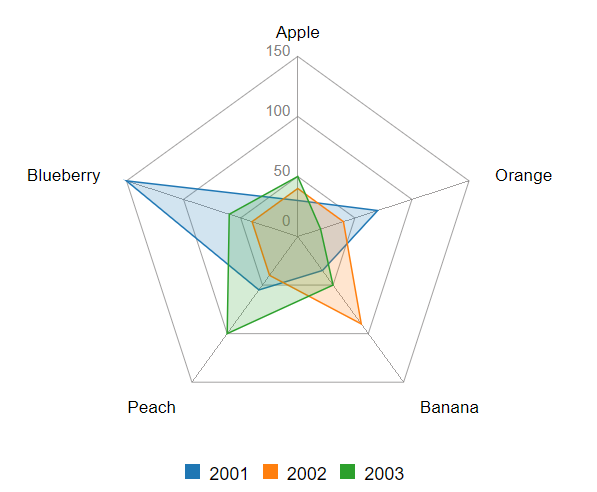
The following example adds a Radar Chart visualisation style. As it is using the included billboard.js library and most of the settings are the same as other "Axis" based charts, we will just extend that chart and add the settings specific to the radar chart.
<?php

namespace Drupal\dvf\Plugin\Visualisation\Style;

use Drupal\Core\Form\FormStateInterface;

/**
 * Plugin implementation of the 'dvf_radar_chart' visualisation style.
 *
 * @VisualisationStyle(
 *   id = "dvf_radar_chart",
 *   label = @Translation("Radar chart")
 * )
 */
class RadarChart extends AxisChart {

  /**
   * {@inheritdoc}
   */
  public function defaultConfiguration() {
    return [
      'radar' => [
        'direction' => [
          'clockwise' => FALSE,
        ],
      ],
    ] + parent::defaultConfiguration();
  }

  /**
   * {@inheritdoc}
   */
  public function settingsForm(array $form, FormStateInterface $form_state) {
    $form = parent::settingsForm($form, $form_state);

    $form['radar'] = [
      '#type' => 'details',
      '#title' => $this->t('Radar chart settings'),
      '#tree' => TRUE,
    ];

    $form['radar']['direction']['clockwise'] = [
      '#type' => 'checkbox',
      '#title' => $this->t('Clockwise'),
      '#description' => $this->t('Draw the chart in a clockwise direction.'),
      '#default_value' => $this->config('radar', 'direction', 'clockwise'),
    ];

    return $form;
  }

  /**
   * {@inheritdoc}
   */
  public function chartBuildSettings(array $records) {
    $settings = parent::chartBuildSettings($records);

    // The billboard.js chart type.
    $settings['chart']['data']['type'] = 'radar';

    // The overrides key gets merged into the billboard.js config object.
    // @see https://naver.github.io/billboard.js/release/latest/doc/Options.html#.radar
    $settings['overrides']['radar']['direction']['clockwise'] = (bool) $this->config('radar', 'direction', 'clockwise');

    return $settings;
  }

}This is using the example from CSV Datasource
If you are using a different frontend library, you will to provide your own builder function, as defined here which would internally return something like this. You can the get the settings using this approach.