CSV Datasource
A CSV visualisation is the most basic of visualisations, so if you are new to DVF this is a great place to start.
This page will cover creating a Spline chart visualisation on a Basic page using the data from an uploaded
CSV file.
A DVF field can be added to any entity type that uses the Drupal field API. For example node, taxonomy, paragraph,
etc. In this example we assume you are adding your visualisation to a Basic page also known as Standard page in
govCMS.
- Visit
Manage fieldson theBasic pagecontent type (Structure > Basic page > Manage fields). - Click
Add fieldand underAdd new field, selectVisualisation file(if the CSV was on another server you would use Visualisation URL). Give the field a name (eg "DVF CSV File"), Save and continue. - Defaults are fine for field settings, click Save field settings
- Select the
Visualisation sourceand set it toCSV file, SetAllowed file extensionstoCSV. Save settings - Check
Manage form displayandManage displayto ensure your new field is visible. If using govCMS default content types, underManage displayclickFull contentthen add to the default view mode.
For this example, the following CSV file will be used fruit-grown-per-year.csv.
Fruits,2001,2002,2003
Apple,30,40,50
Orange,70,40,20
Banana,35,90,50
Peach,55,40,100
Blueberry,150,40,60
Create a new page (Content > Add content > Basic page) and you should see your new field "DVF CSV File" (or whatever you
named it). Click "Choose file" and upload your fruit-grown-per-year.csv file.
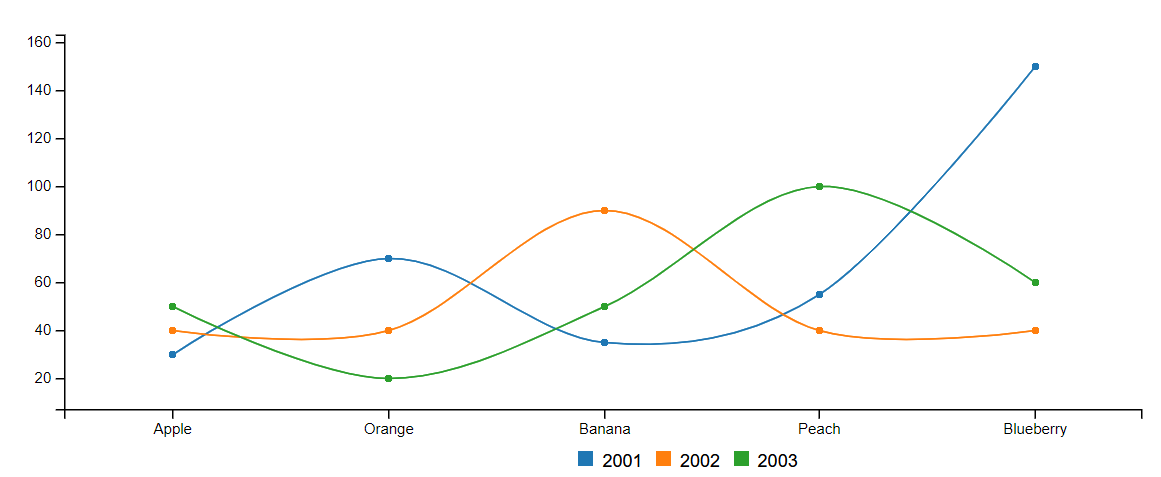
In this example, our goal is to do the following:
- Display a line for each year
- Display the fruit types along the bottom X axis
- The count of fruits will be the Y axis
It should look like this
- Select
Spline chartunderVisualisation style - As we want a line (dataset) for each year, under
Data settings>Fields, ensure each year is selected, do not selectfruitsas this will be our axis labels. - As we want to display the fruit types along the bottom X axis, expand
Axis settingsthenX Axis settings. In the Tick values field, selectFruits(the column with the labels).
Click save and view your data visualised as a graph, it should look like the above screenshot.
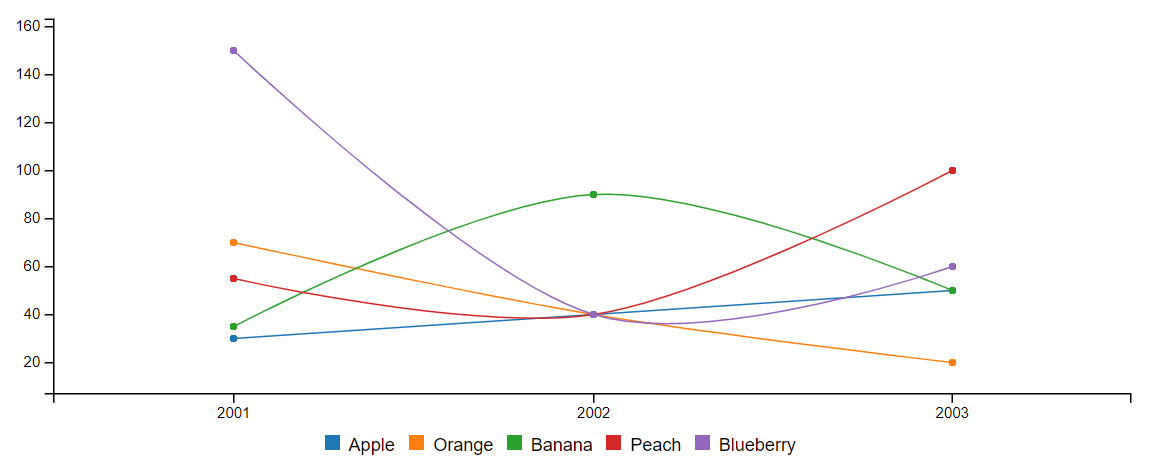
If you wanted to change up how this data is displayed and have a line for each fruit and the years displayed along the
X axis, you can easily do this using the X axis grouping setting (Settings > Axis settings > X axis settings). By
default this is set to Group by keys but changing it to Group by label values will switch things around, and result
in your graph looking like this: