UsingTheToolboxOverview
This page gives a brief overview on how to use the toolbox. You are encouraged to provide feedback on any aspect of the toolbox (e.g. is the user interface intuitive, easy to use?). Check out the installation instructions for details on how to get the toolbox up and running.
Before starting the toolbox, keep in mind that you will need to configure it first, especially by setting your deployment database, your use mode timeSeries or profile and your NetCDF templates.
-
The standalone version of the toolbox is started by running the relevant
.bator.shfile depending on your operating system. These files are preferred to the.exeor.binsince they will keep the console open at the end of any crash so that you can read any error message.- On Windows you can just double click on the relevant
.batfile. - On Linux you need to run
./imosToolbox_Linux64.sh $MCR_ROOTin a terminal where$MCR_ROOTis your Matlab Component Runtime root directory (e.g./home/ggalibert/Matlab/MATLAB_Compiler_Runtime/v80/).
- On Windows you can just double click on the relevant
-
If you are using the toolbox within Matlab, the toolbox is started via the
imosToolboxfunction when positioned in the toolbox root directory:
>> imosToolbox
It is possible to retrieve the toolbox's version being currently used by running the following within Matlab:
>> imosToolbox version
The toolbox can be executed in a fully automated manner, by passing some arguments to the imosToolbox function. A deployment database must be present in order to run the toolbox automatically. When you pass the string 'auto' to the imosToolbox function, the toolbox will import all of the files specified in the deployment database, using the field trip and data directory last specified in toolboxProperties.txt for its current mode (profile or timeSeries), run the data sets through the last chosen set of pre-processing and QC routines, and export the data sets as NetCDF to the last specified export directory :
- For example using the standalone Windows 32bit version, you can use the
imosToolboxBatch_Win32.batfile which contains the default following code :
imosToolbox_Win32.exe auto
pause
Just double click on this file to execute it.
- Using the source code within MATLAB just proceed as follow :
>> imosToolbox auto
Alternatively, you can specify the field trip, data directory, pre-processing routines, QC routines and export directory as arguments to imosToolbox :
- For example using the standalone Windows 32bit version, edit the
imosToolboxBatch_Win32.batfile so that it includes something like :
imosToolbox_Win32.exe auto "4788" "C:\Raw Data\4788\" "{'depthPP' 'salinityPP' 'magneticDeclinationPP' 'absiDecibelBasicPP' 'adcpNortekVelocityEnu2BeamPP' 'adcpBinMappingPP' 'adcpNortekVelocityBeam2EnuPP'}" "{'imosImpossibleDateQC' 'imosImpossibleLocationSetQC' 'imosInOutWaterQC' 'imosGlobalRangeQC' 'imosImpossibleDepthQC' 'imosSalinityFromPTQC' 'imosSideLobeVelocitySetQC' 'imosTiltVelocitySetQC' 'imosHorizontalVelocitySetQC' 'imosVerticalVelocityQC' 'imosCorrMagVelocitySetQC' 'imosHistoricalManualSetQC'}" "C:\NetCDF\4788\"
pause
You can add as many lines in this imosToolboxBatch_Win32.bat file as mooring deployments that need to be processed sequentially.
- Using the source code within MATLAB just type as follow :
>> imosToolbox auto '4788' 'C:\Raw Data\4788\' {'depthPP' 'salinityPP' 'magneticDeclinationPP' 'absiDecibelBasicPP' 'adcpNortekVelocityEnu2BeamPP' 'adcpBinMappingPP' 'adcpNortekVelocityBeam2EnuPP'} {'imosImpossibleDateQC' 'imosImpossibleLocationSetQC' 'imosInOutWaterQC' 'imosGlobalRangeQC' 'imosImpossibleDepthQC' 'imosSalinityFromPTQC' 'imosSideLobeVelocitySetQC' 'imosTiltVelocitySetQC' 'imosHorizontalVelocitySetQC' 'imosVerticalVelocityQC' 'imosCorrMagVelocitySetQC' 'imosHistoricalManualSetQC'} 'C:\NetCDF\4788\'
If no pre-processing or quality control routine should be performed then provide an empty cell array {}.
Also, bear in mind that while any QC test is performed :
- if any .mqc file exists next to the data file then using the imosHistoricalManualSetQC test will set previously manually flagged data.
- if any .pqc file exists next to the data file then any set parameter for a specific QC test (for example imosSideLobeVelocitySetQC) will be used instead of the default parameter values found in the relevant .txt parameter file (for example here in imosSideLobeVelocitySetQC.txt).
Upon starting the toolbox, you will be prompted to select a raw data file to import:
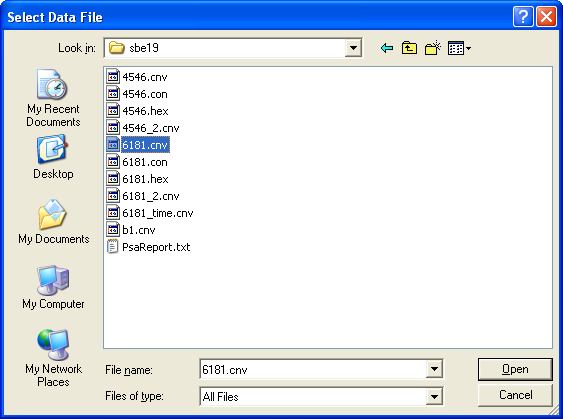
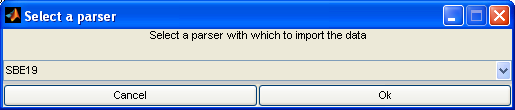
Once you choose a file, you will be prompted to choose which parser to use to import the data. Choose the parser appropriate for the file.
Upon starting the toolbox, you are first presented with the following dialog:
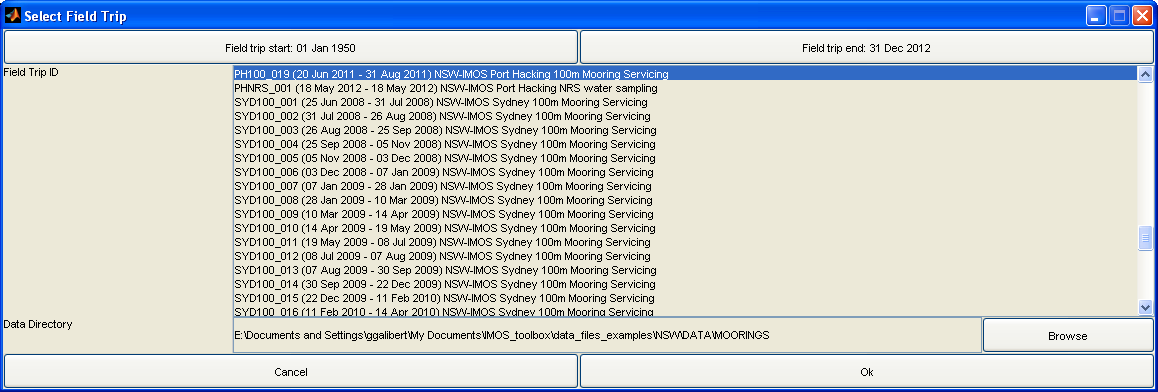
Choose the field trip in which you are interested, and the directory which contains the raw data related to that field trip. You can use the top buttons to select a date range over which to filter the list of field trips to choose from.
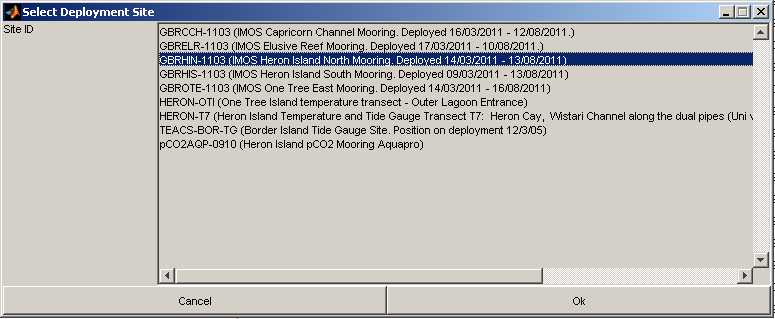
Once you have selected a field trip and a data directory, if there are more than one site involved then you will be asked to chose which one you would like to process with the following dialog:
Finally the toolbox will attempt to match up deployments with raw data files found in the data directory. You will then be presented with the following dialog:
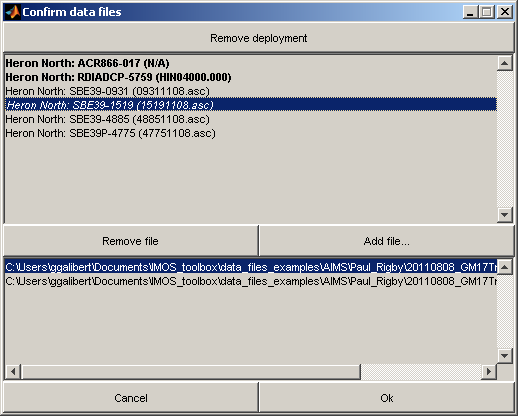
The top half of the dialog contains the list of all deployments related to the field trip; the bottom half contains the list of all files which were found, that correspond to the currently selected deployment.
Some of the deployments are highlighed:
- A red deployment indicates that the information in the ddb was invalid.
- A bold deployment indicates that the toolbox could not find any files related to that deployment.
- An italicised deployment indicates that multiple files with the same name but at different location were found for that deployment. The user can choose which one should be loaded but best is to clean the directory content so that only one file with the relevant name is found.
The dialog allows you to resolve any discrepancies between the information in ddb and the raw data files, by removing deployments, and adding/removing files to/from deployments.
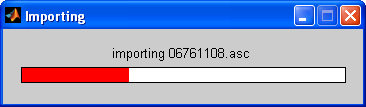
When you are happy with the list of deployments for which data is to be imported, confirm the dialog; you will be presented with a progress bar while the data is imported:
After import, you may be presented with a dialog allowing you to choose from a list of preprocessing routines:
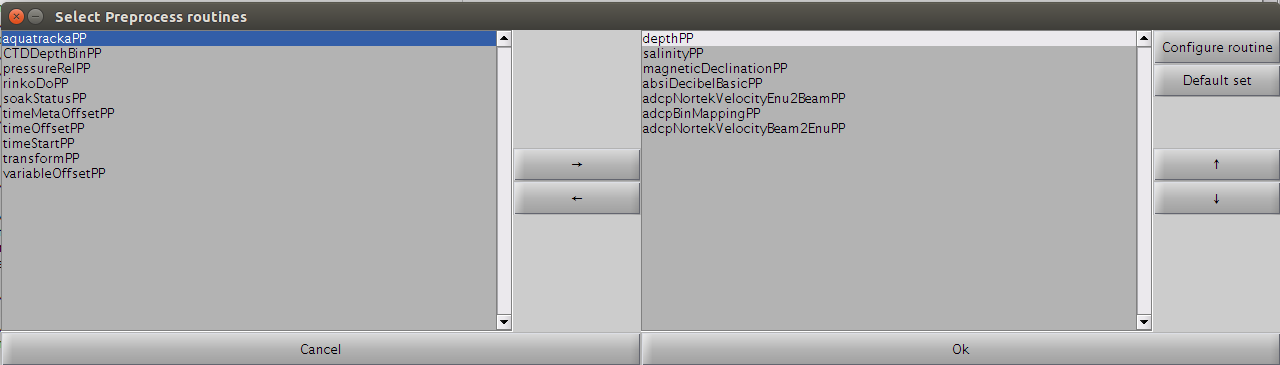
A set of routines is already selected by default in the right list. Some can be added/removed from/to the left list. Finally, their order matters and they can be re-arranged as desired. To reset the list of pre-processing routines to a default list, just hit the 'Default set' button. The default list of routines is stored in the toolboxProperties.txt file.
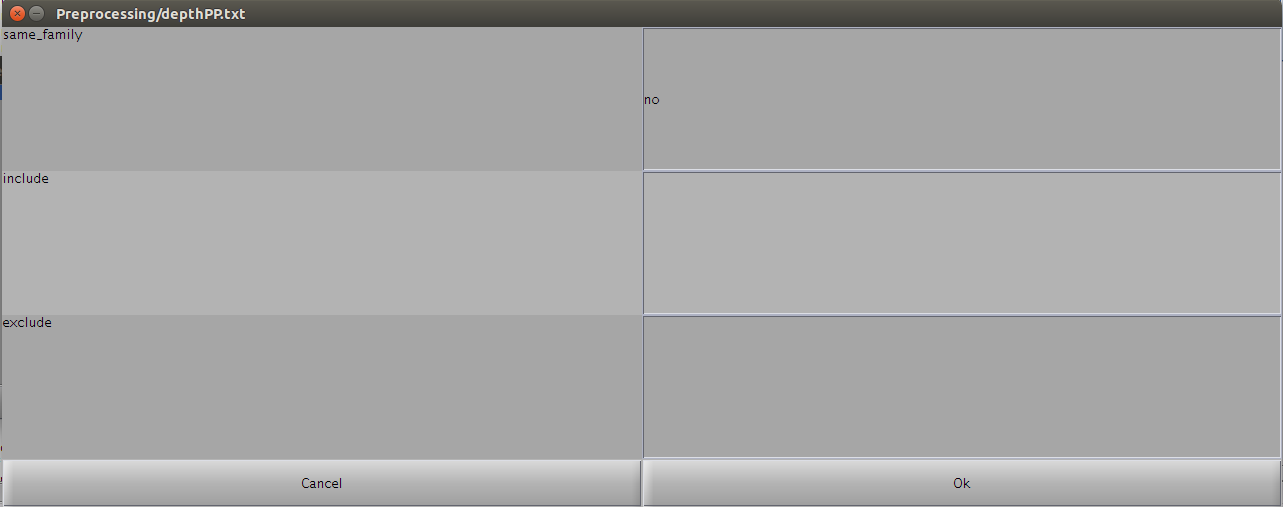
Some of these PP routines can be parameterised by modifying their associated parameter .txt file either manually (open the parameter file with a text editor) or for some directly via the GUI by clicking on the 'Configure routine' button. Below is an example on how to modify the depthPP.txt parameter file via the GUI:
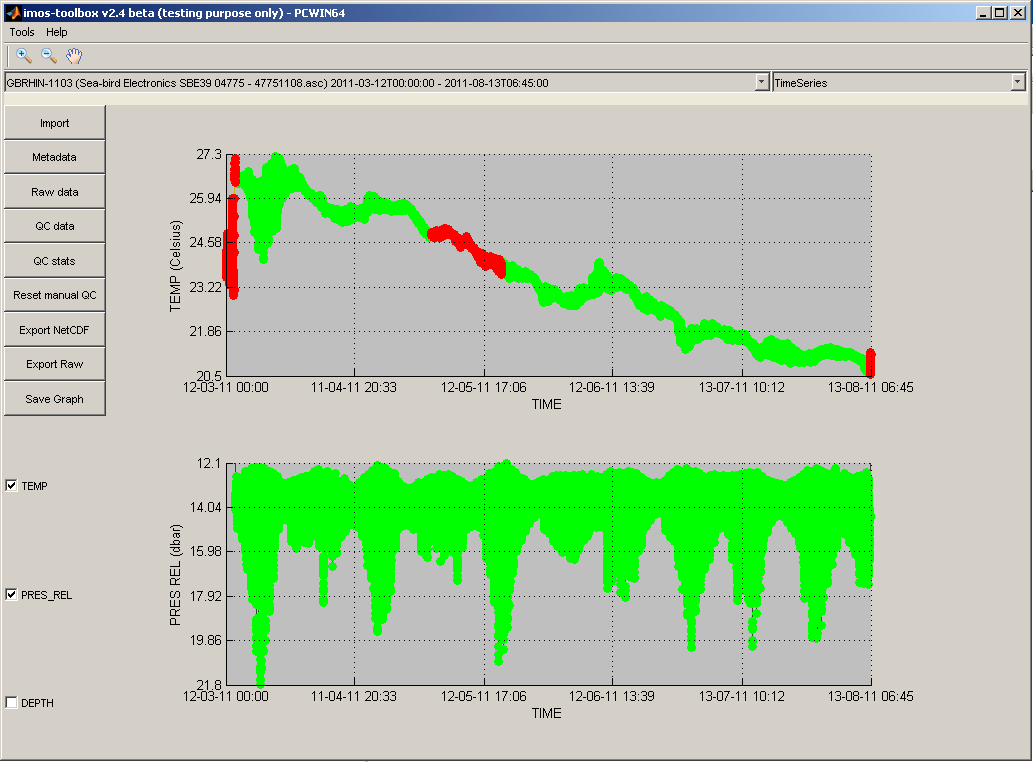
When the data has been imported, you will be presented with the main window, which allows you to view the sample data, data set by data set. You can use zoom in zoom out and pan functions. With the panel at the bottom left you can choose to omit parameters. Below is the timeseries view which is the default view in timeSeries mode :
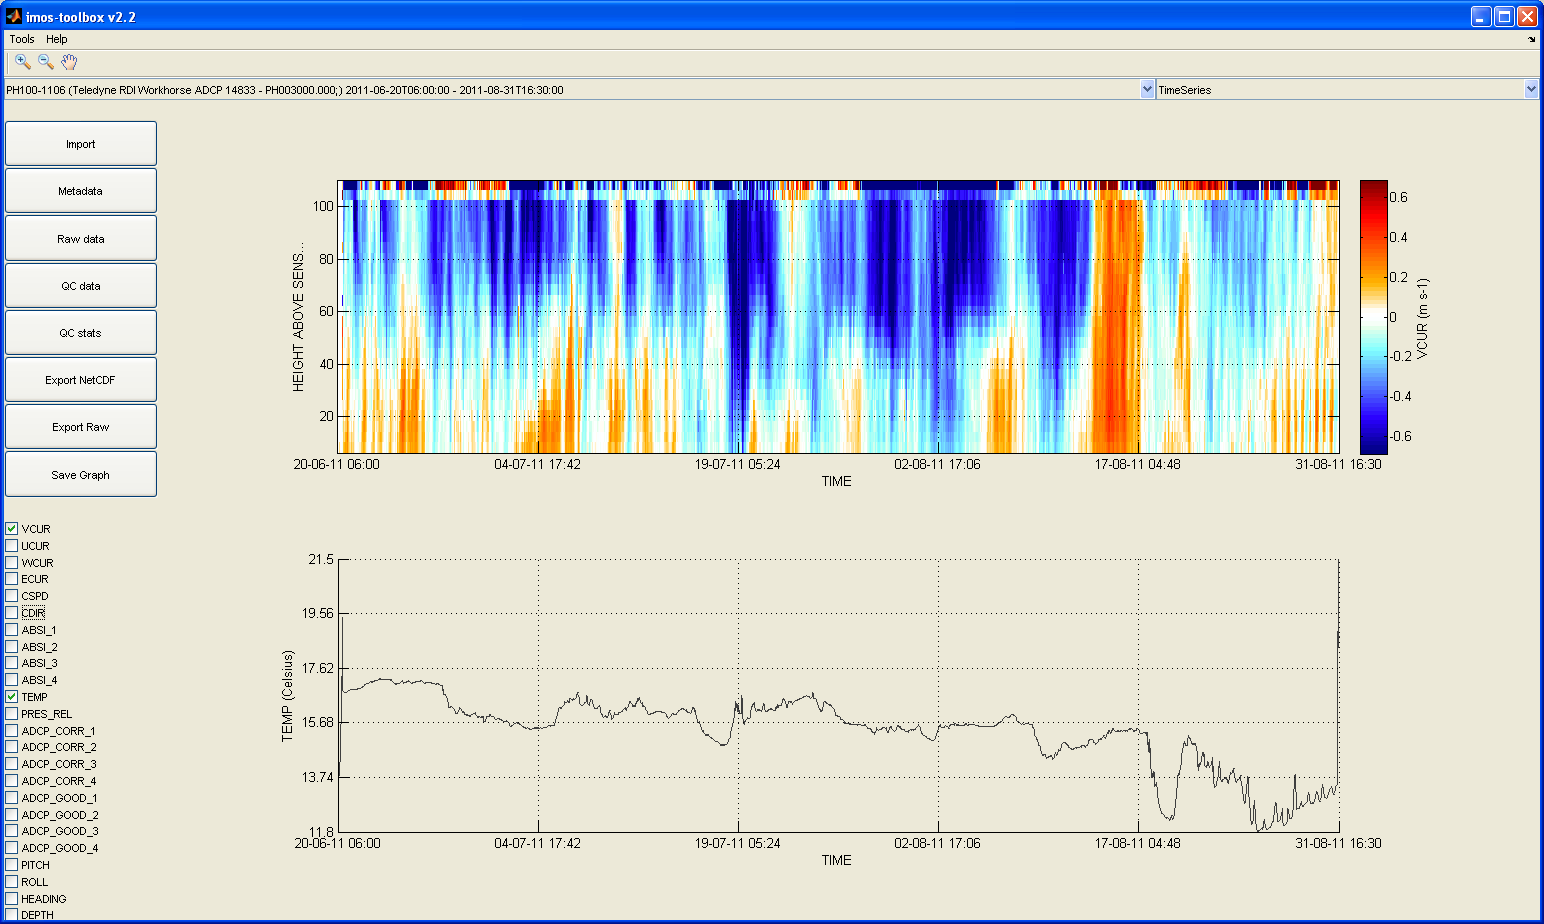
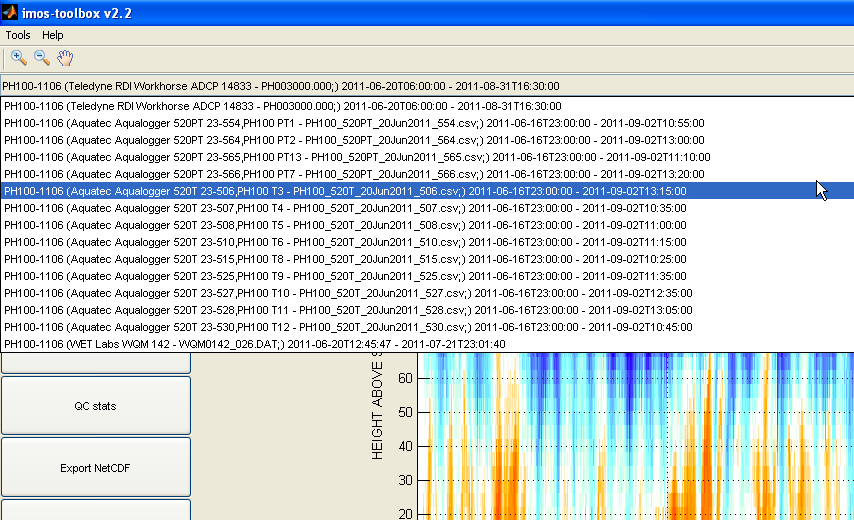
Use the drop down menu at the top left window to select the data set to view.
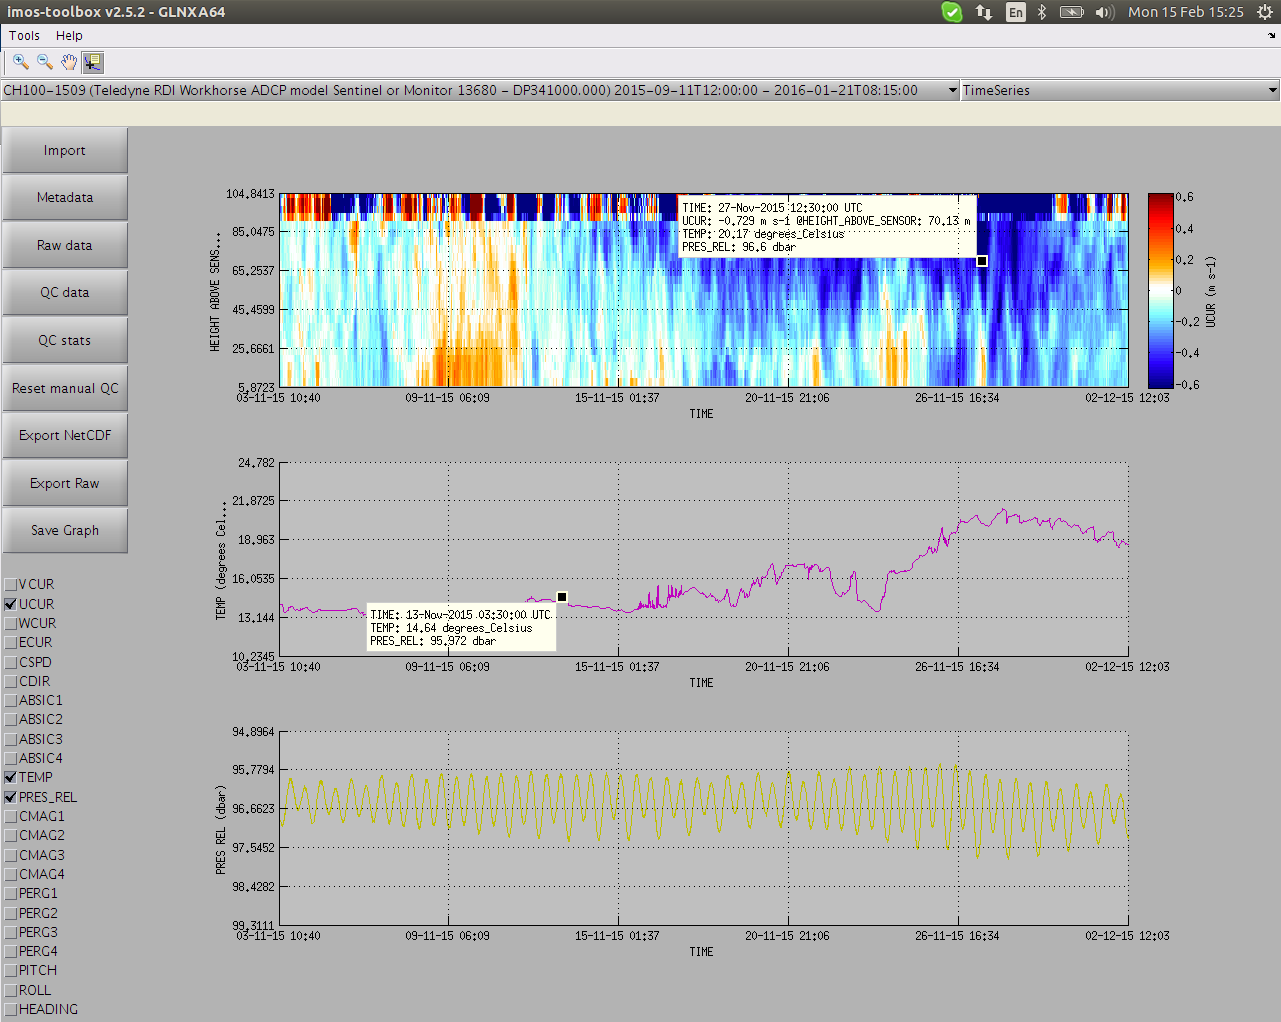
You can use MATLAB's data cursor feature in the up-left corner of the main window (next to the pan button) to click and display data values at any spot on a plot. A data cursor can be panned and displays the time and data value where you clicked on a graph as well as the data values at the same time for any other graph plotted on the main window:
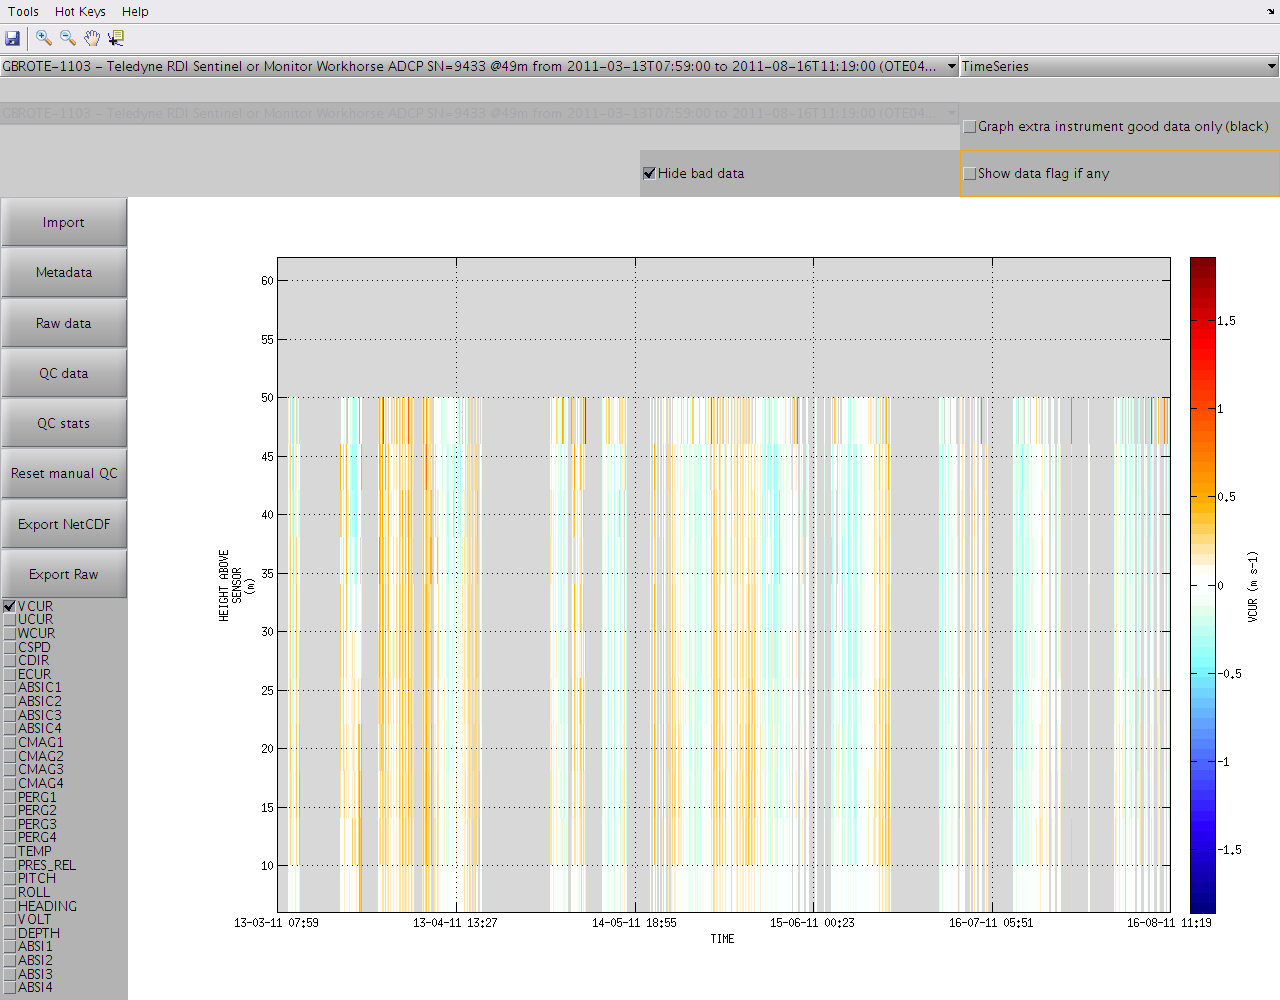
As soon as you hit the "QC data" button and QC routines have ran, all the QC flags are displayed by default on top of the data.
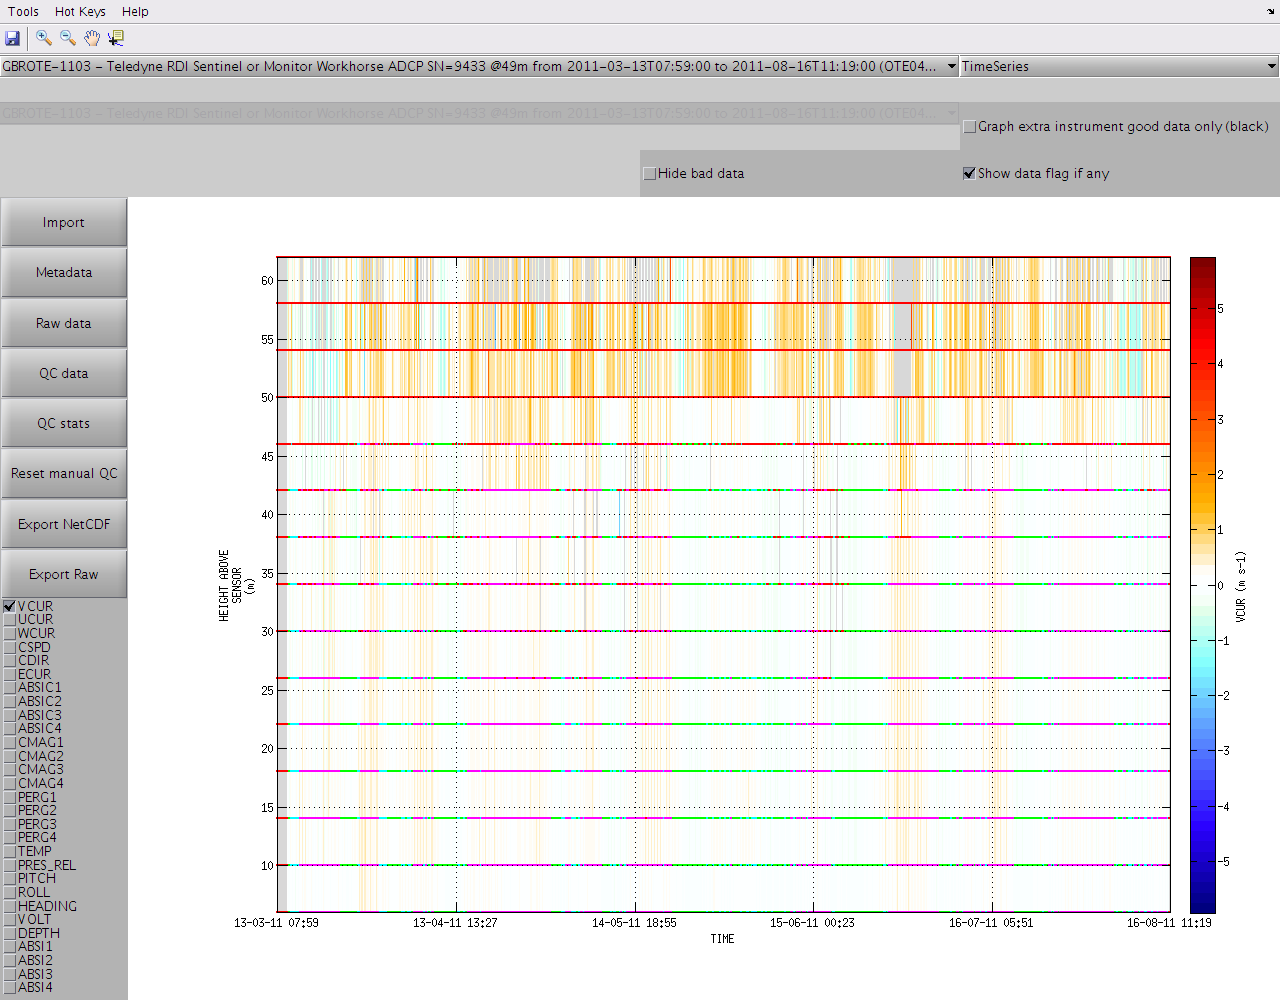
If you wish to disable the display of the QC flags just untick "Show data flag if any" in the top right corner of the window. Ticking "Hide bad data" will also make any data with flag >= 3 invisible to the graph and the colorbar range will be adjusted automatically.
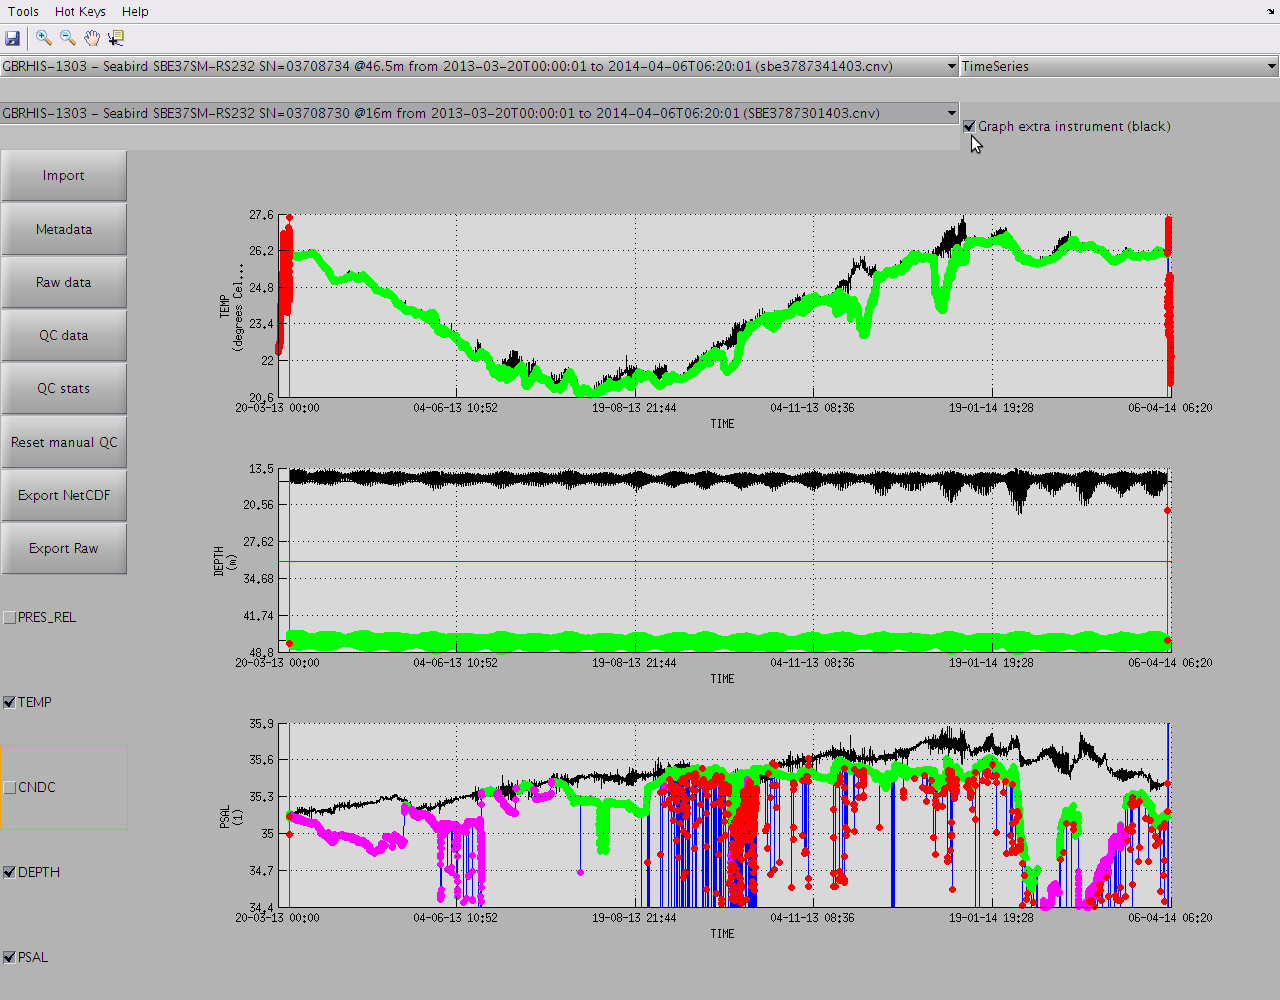
You can display an extra dataset from a different instrument for cross-validation by enabling "Graph extra instrument (black)" in the top right corner:
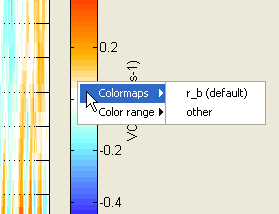
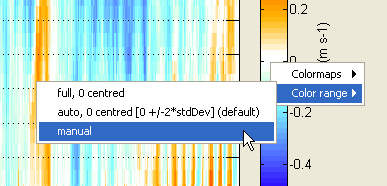
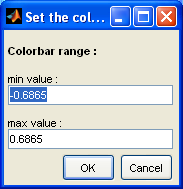
You can tune the colorbar colormap and color range settings by right-clicking on the colorbar and using the context menu. Each family of parameters has it own context menu with different default settings:
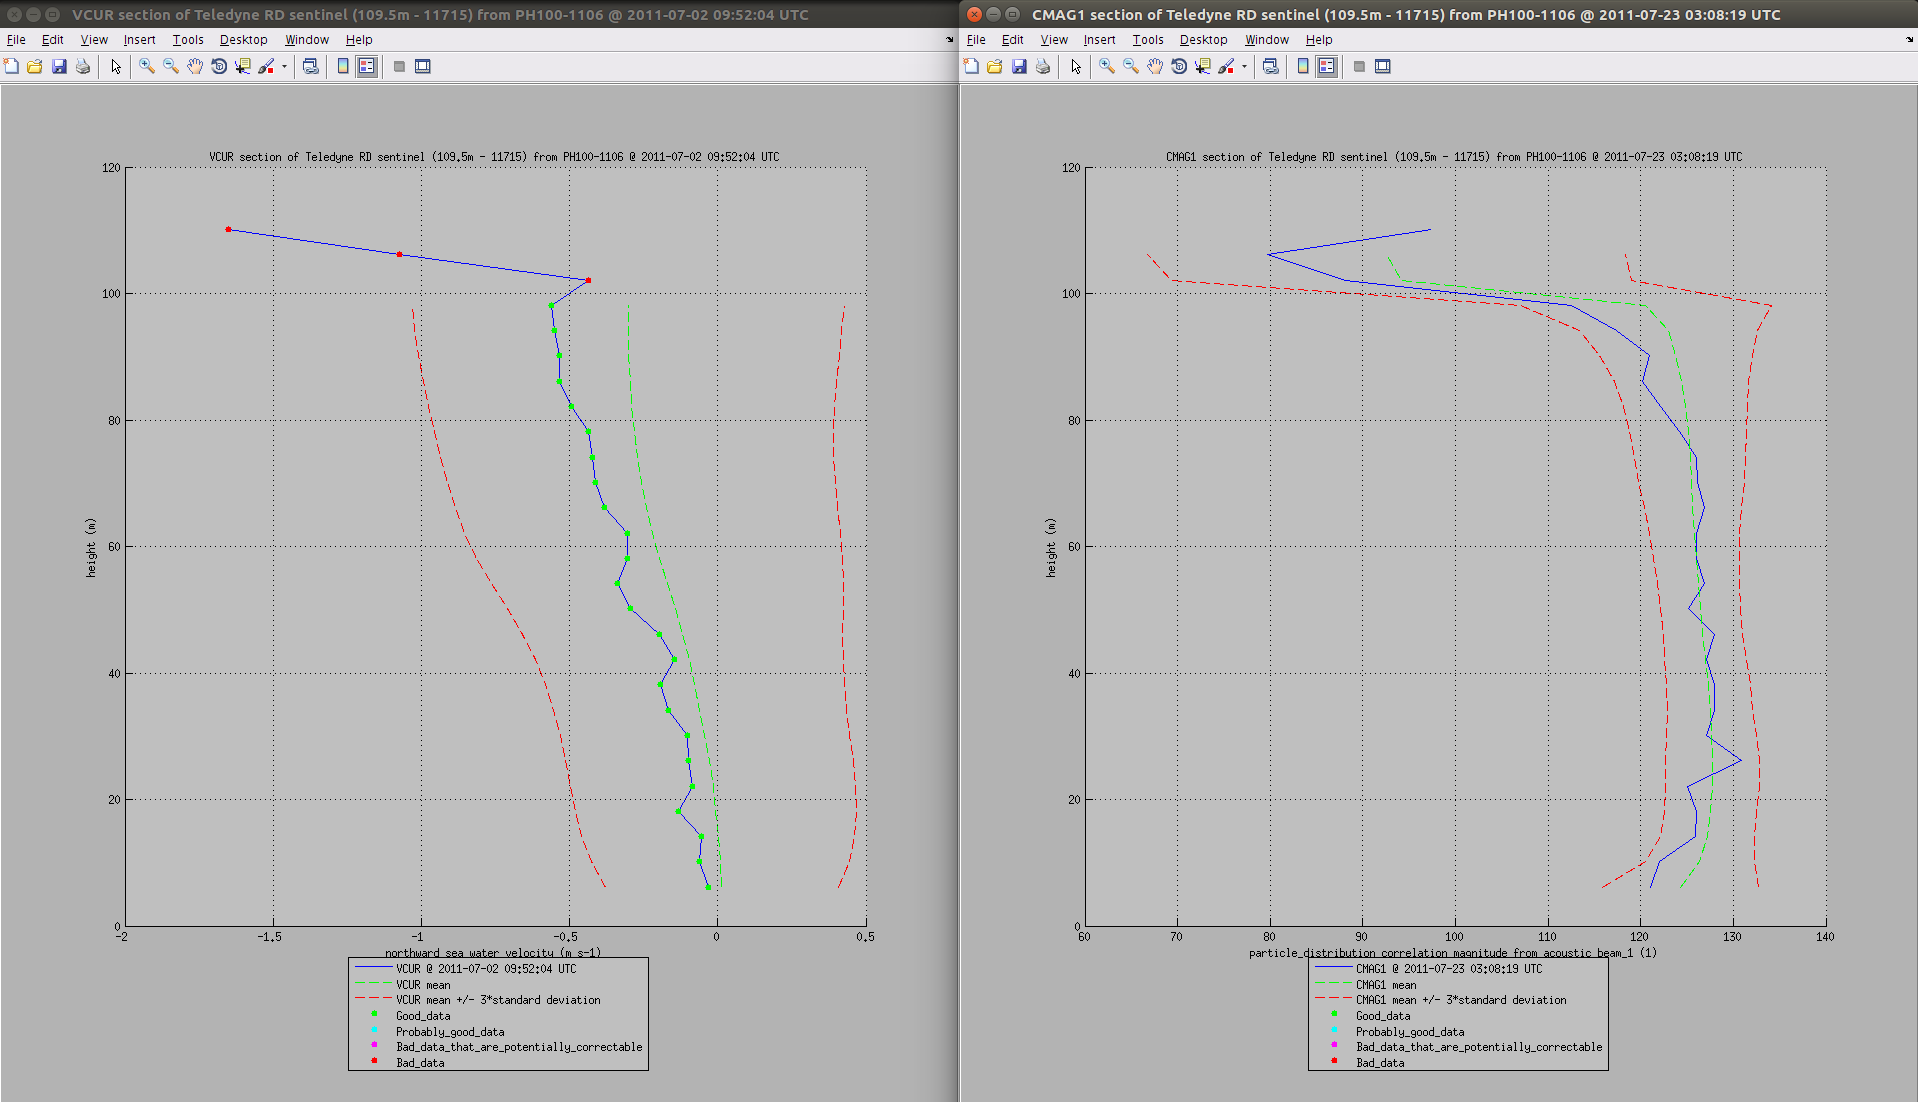
If one of the displayed parameter has 2 dimensions (like UCUR) then you can left-click anywhere on the 2D plot so that it will generate in a new window a cross section plot over the 2nd dimension at the TIME value you clicked:
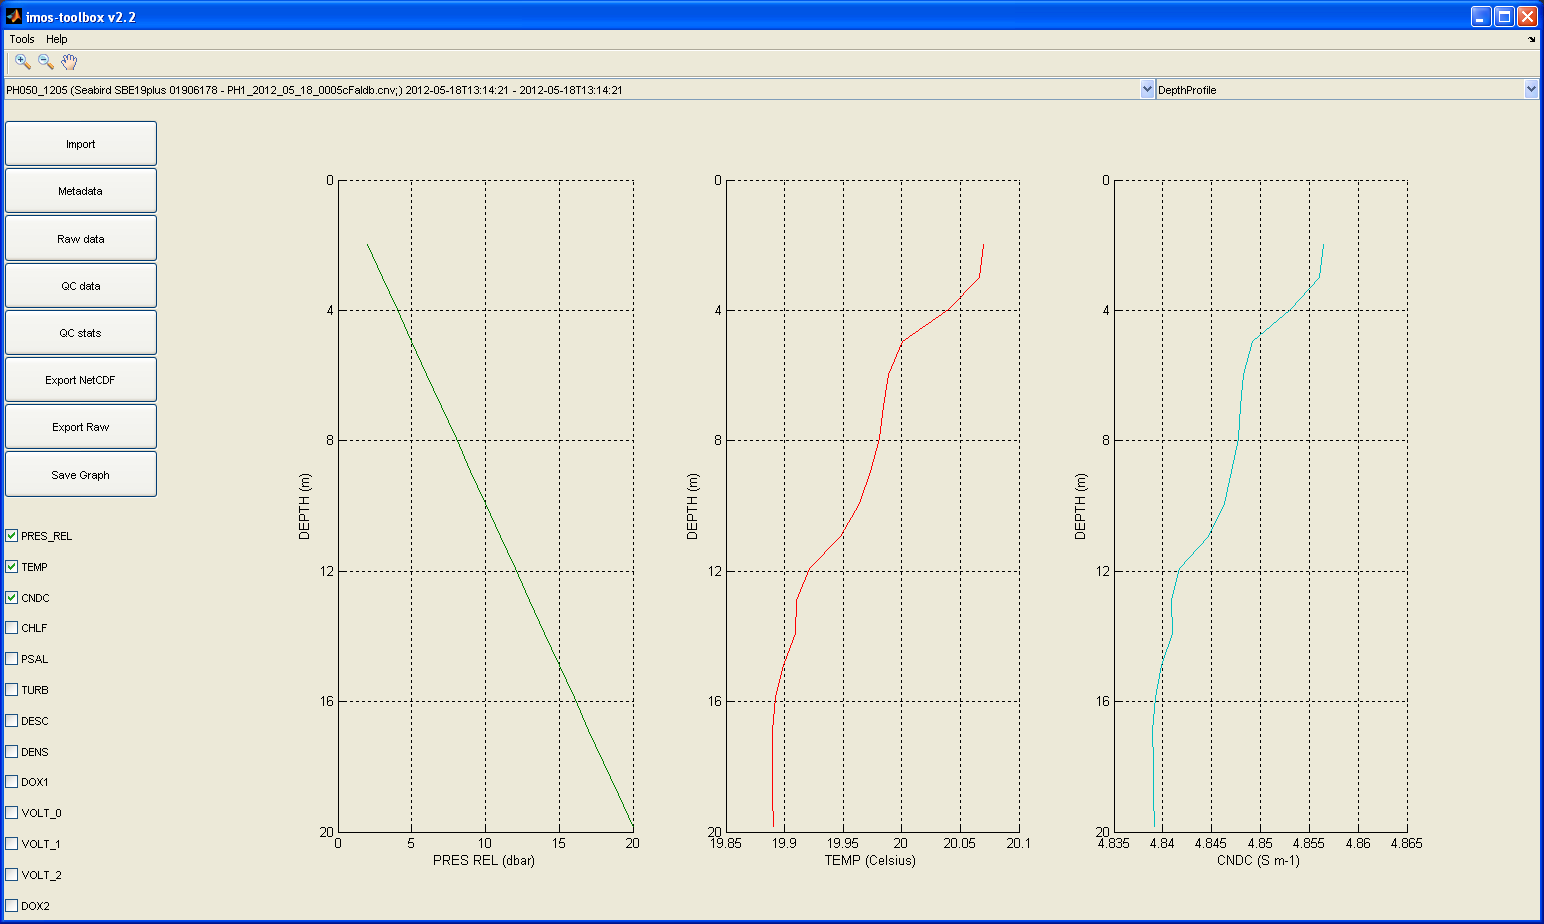
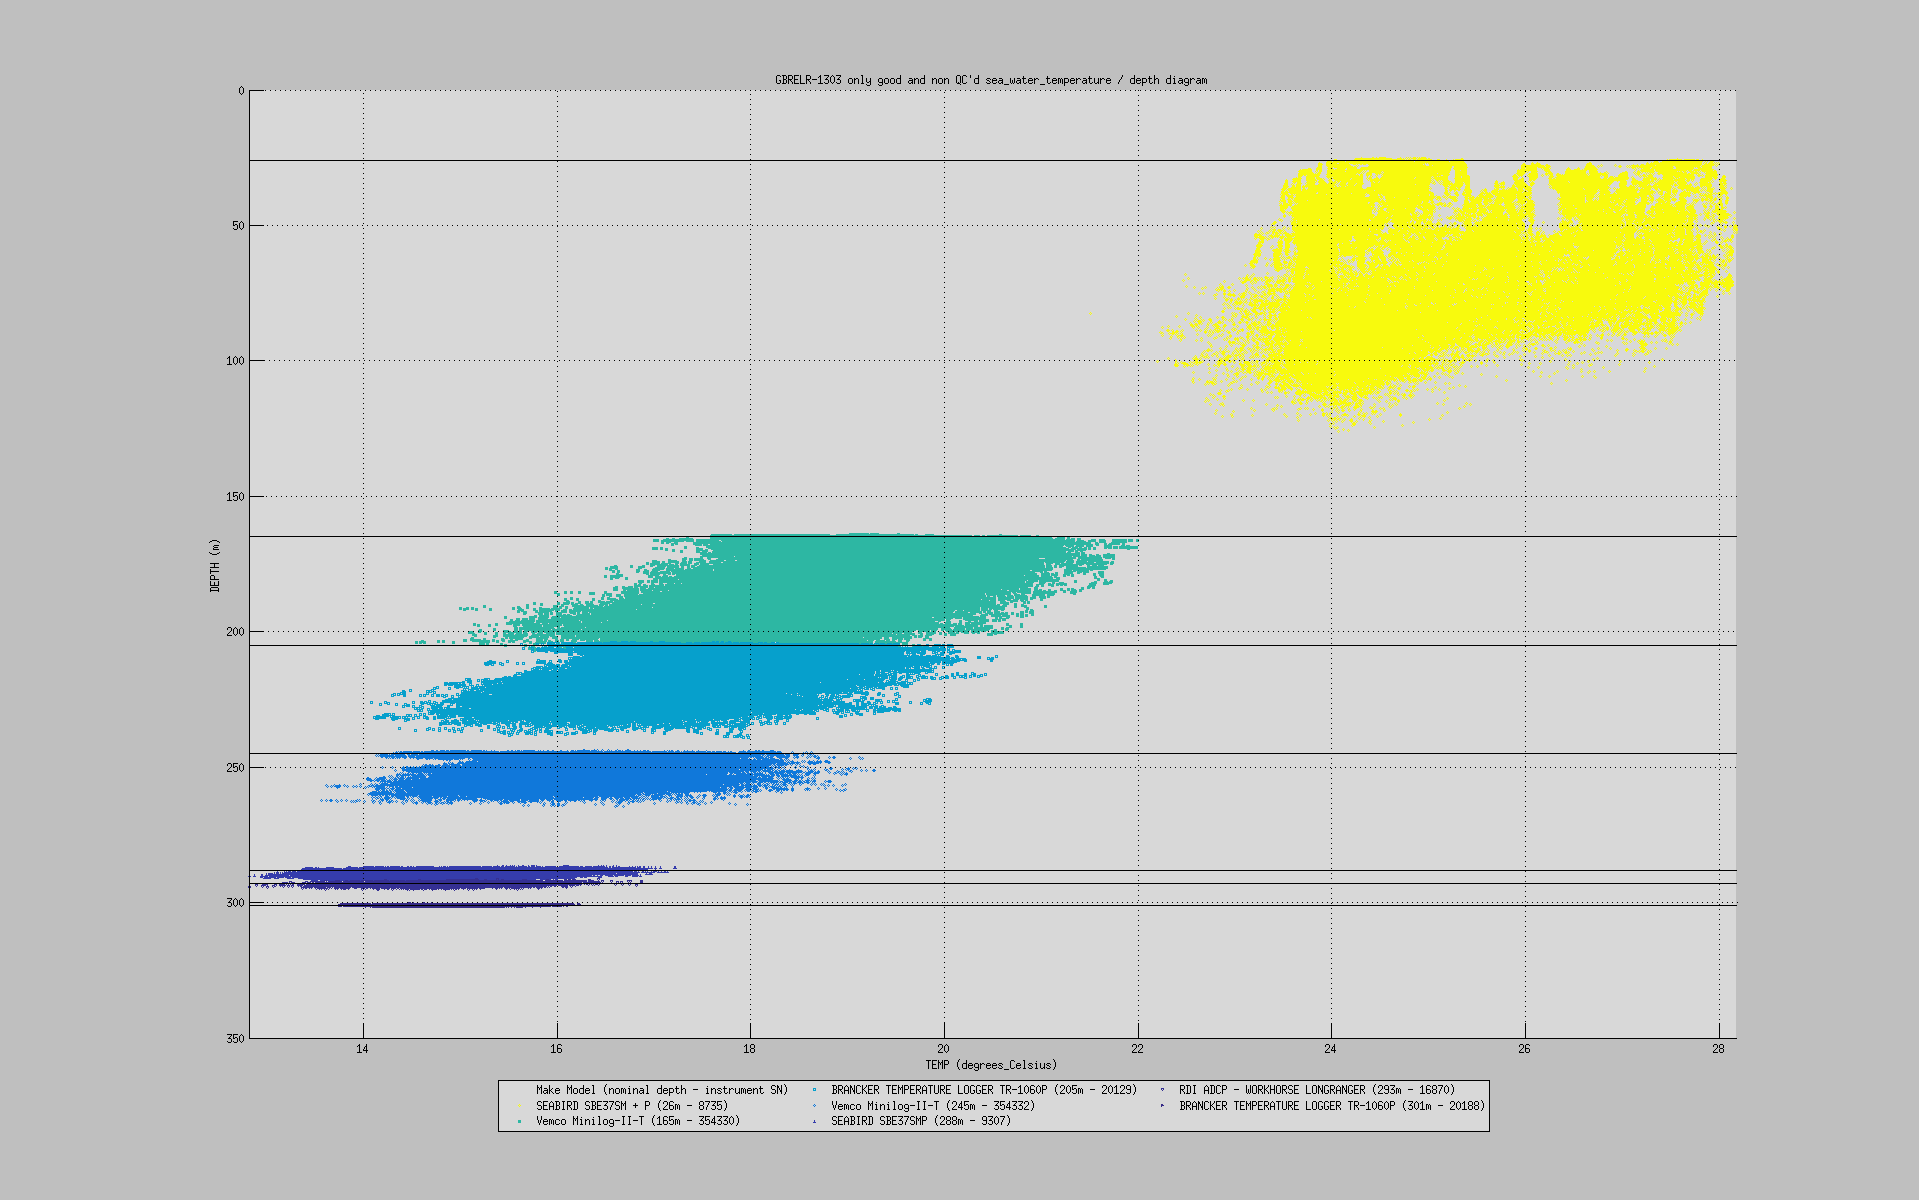
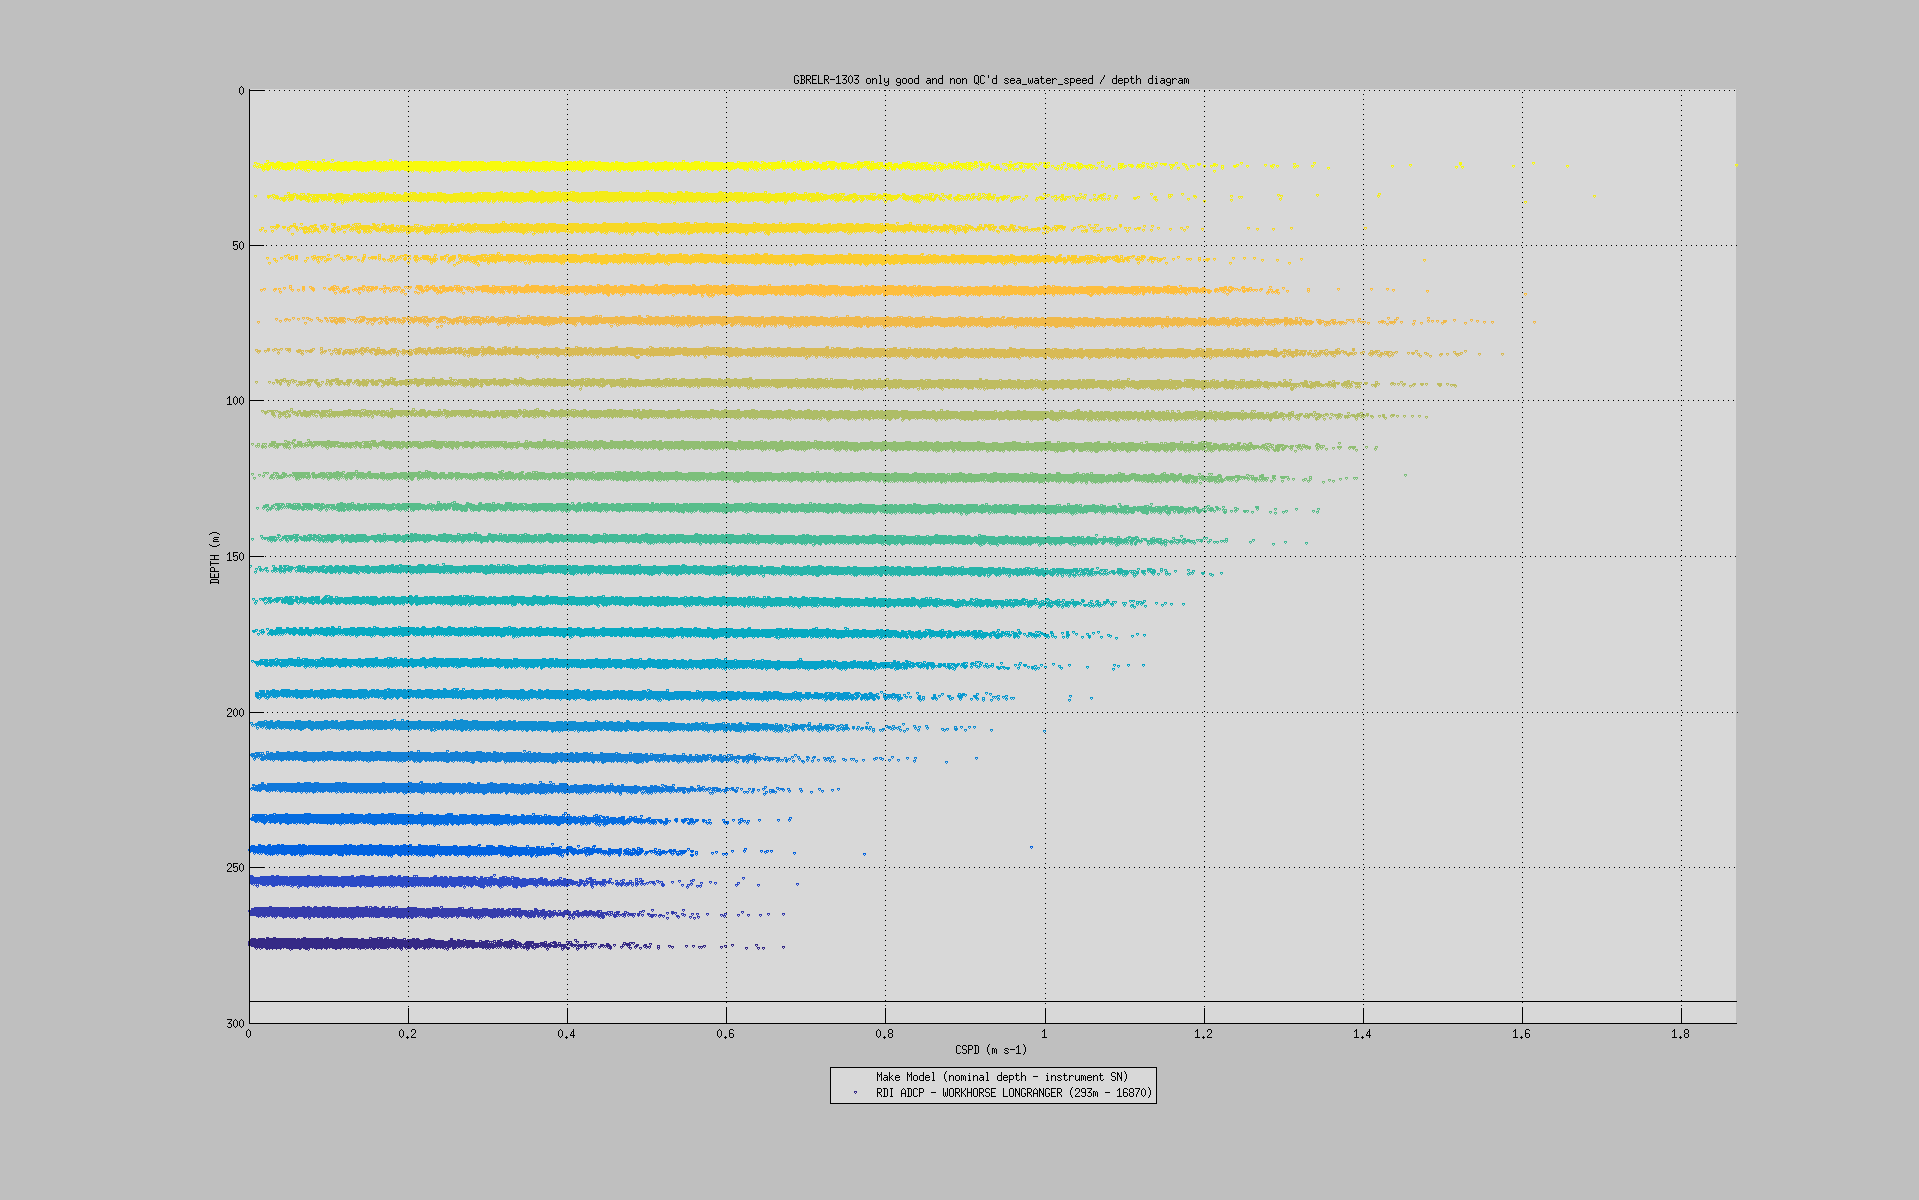
If your data set has a depth dimension or variable, you can view the data as a depth profile, by selecting 'DepthProfile' from the graph list at the top right of the window. This is the default view in profile mode:
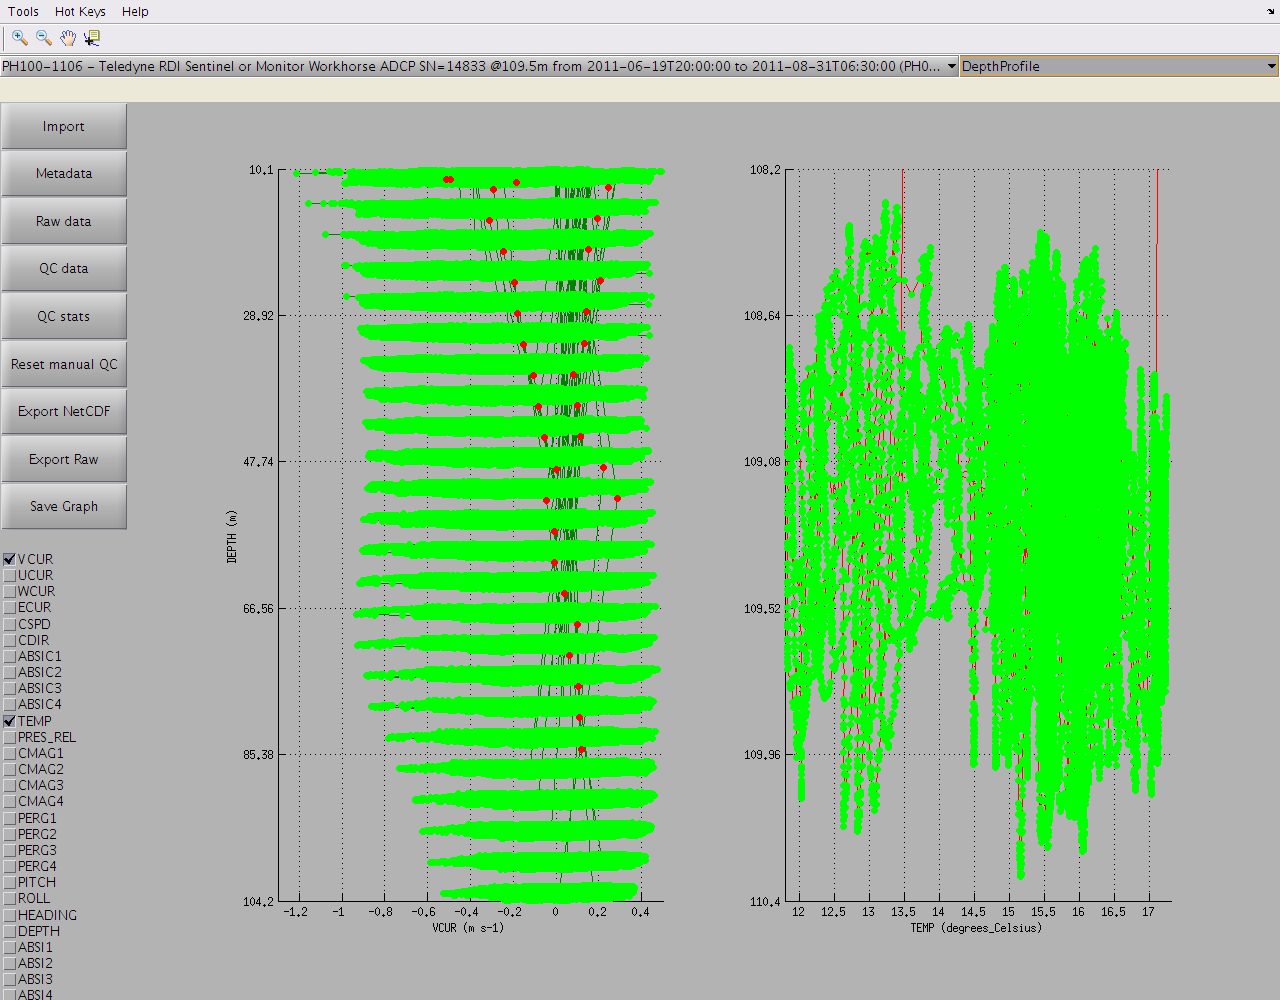
but this can also be accessed in timeSeries mode:
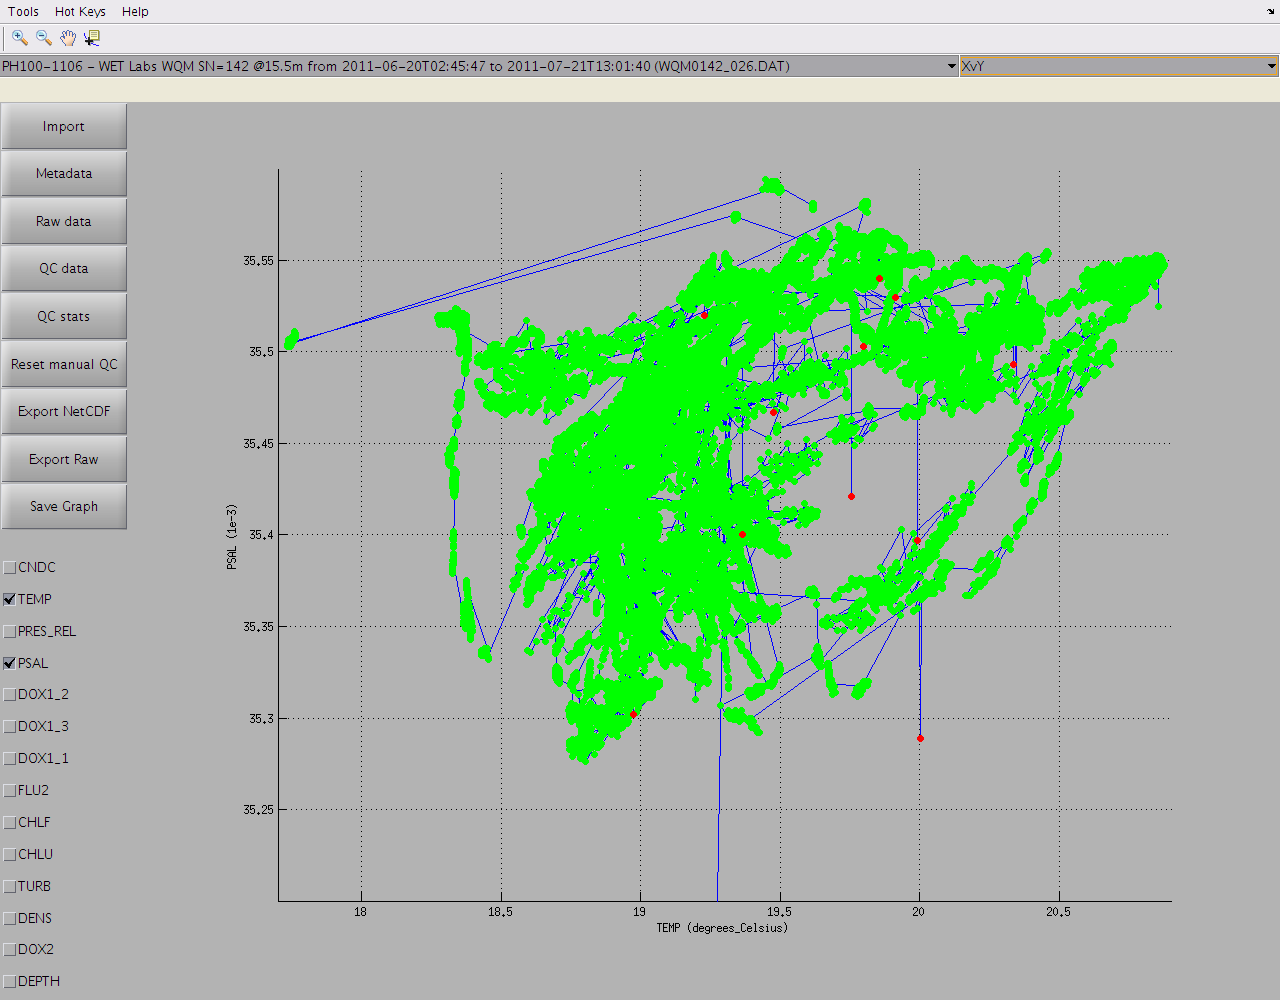
Finally, variables that share the same dimensions can be plotted against each other by selecting 'XvY' from the graph list at the top right of the window. For example in timeSeries mode:
By clicking on the 'Metadata' button on the left, you can view and modify metadata (common metadata entries can even be replicated accross data sets from the current one being displayed by clicking on the 'Replicate' button):
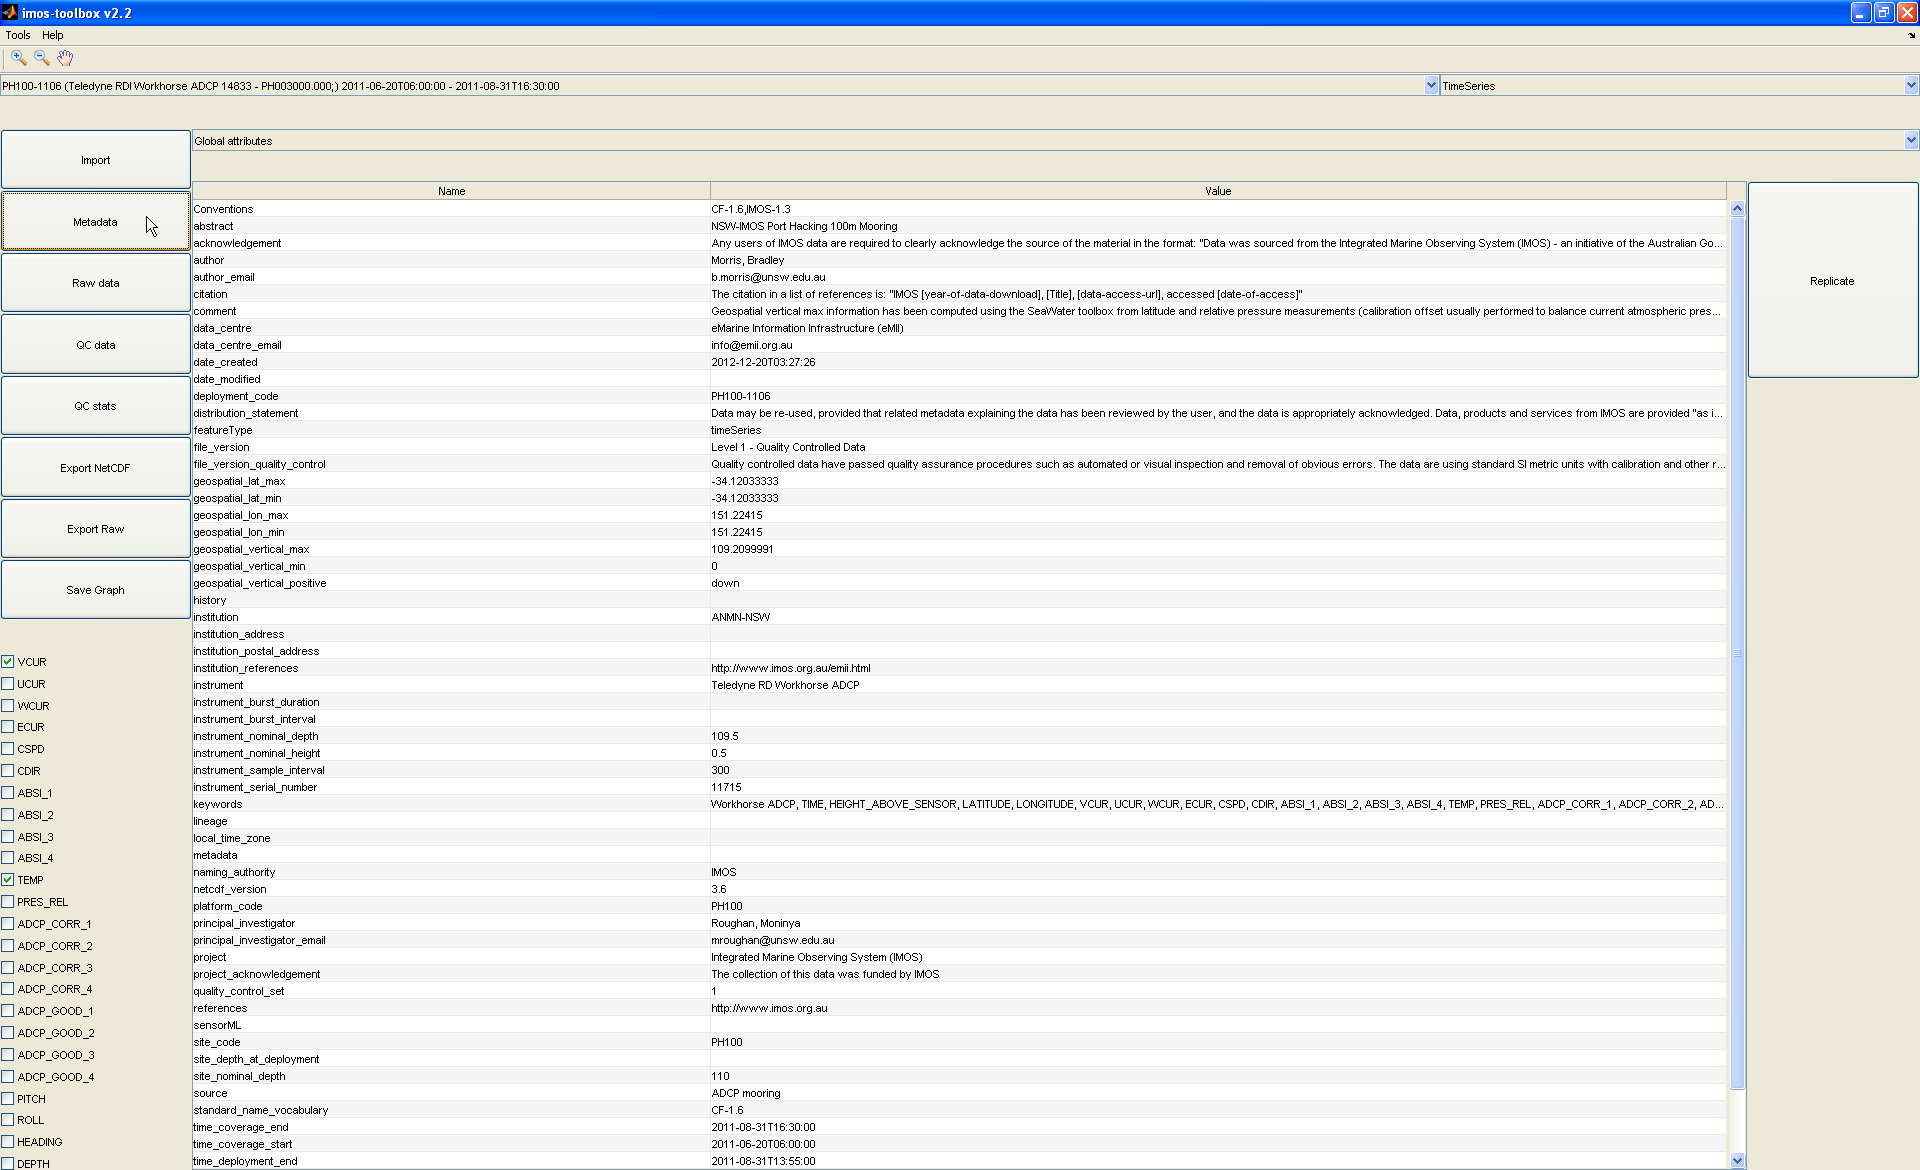
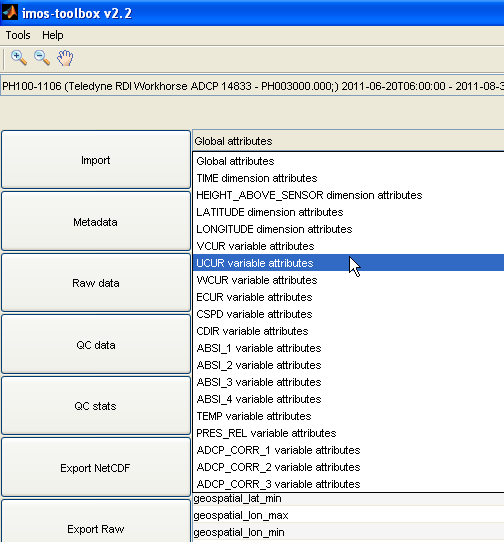
This is possible for global attributes as well as any variable attribute by using the drop down menu at the top of the metadata panel.
By clicking on the 'QC data' button, you can choose to run the data through a set of automatic QC filters, which will automatically flag the data sets.
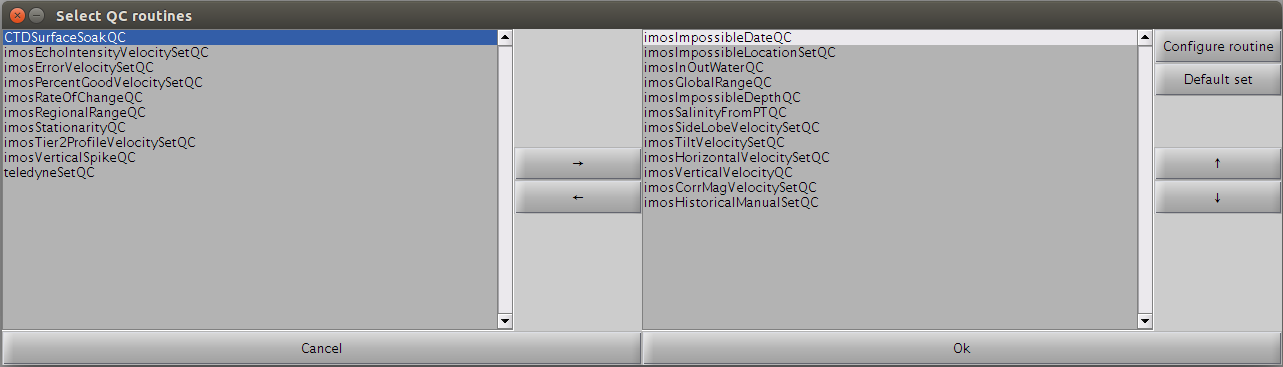
To reset the list of pre-processing routines to a default list, just hit the 'Default set' button. The default list of routines is stored in the toolboxProperties.txt file.
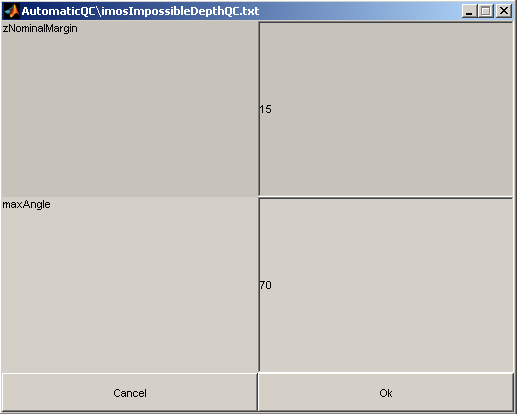
Some of these QC tests can be parameterised by modifying their associated parameter .txt file either manually (open the parameter file with a text editor) or for some directly via the GUI by clicking on the 'Configure routine' button. Below is an example on how to modify the imosImpossibleDepthSetQC.txt parameter file via the GUI:
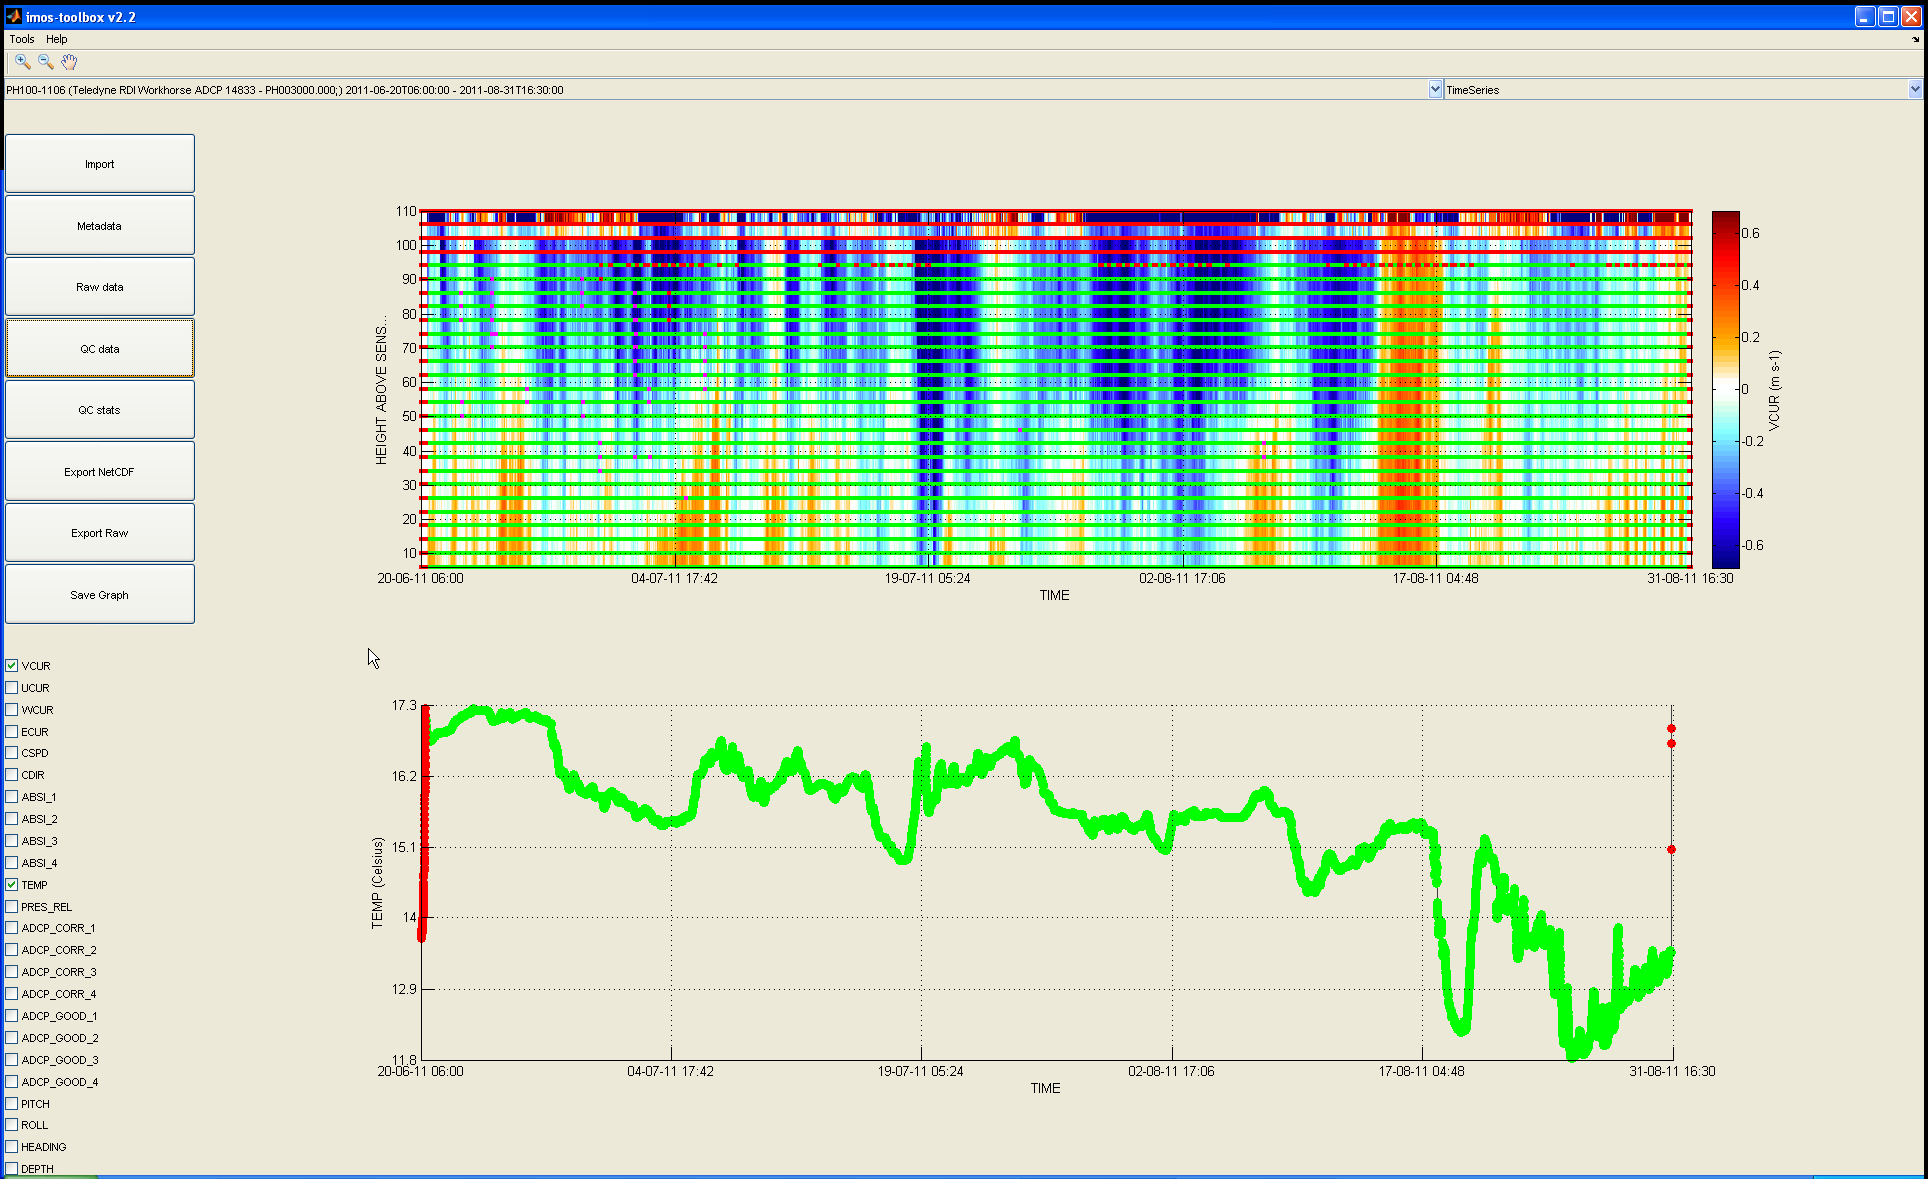
Then the data plotted is the one that has been potentially modified by any pre-processing routine (unlike the data plotted when clicking on the 'Raw data' button) and the QC flags will be overlaid on the graphs:
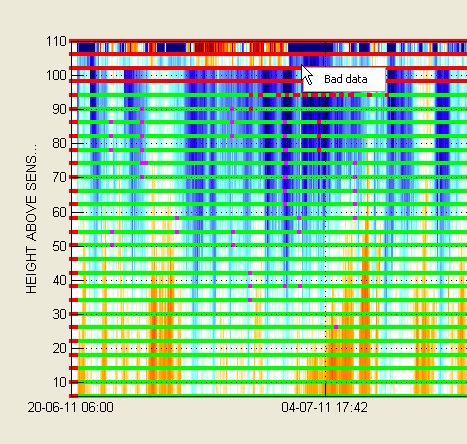
You can see that a few data points have been flagged.
You can display the actual label associated with the overlaying color of the flag by right-clicking on it.
By clicking on the 'QC stats' button, you can access the details of each QC procedure result on each parameter dataset per dataset:
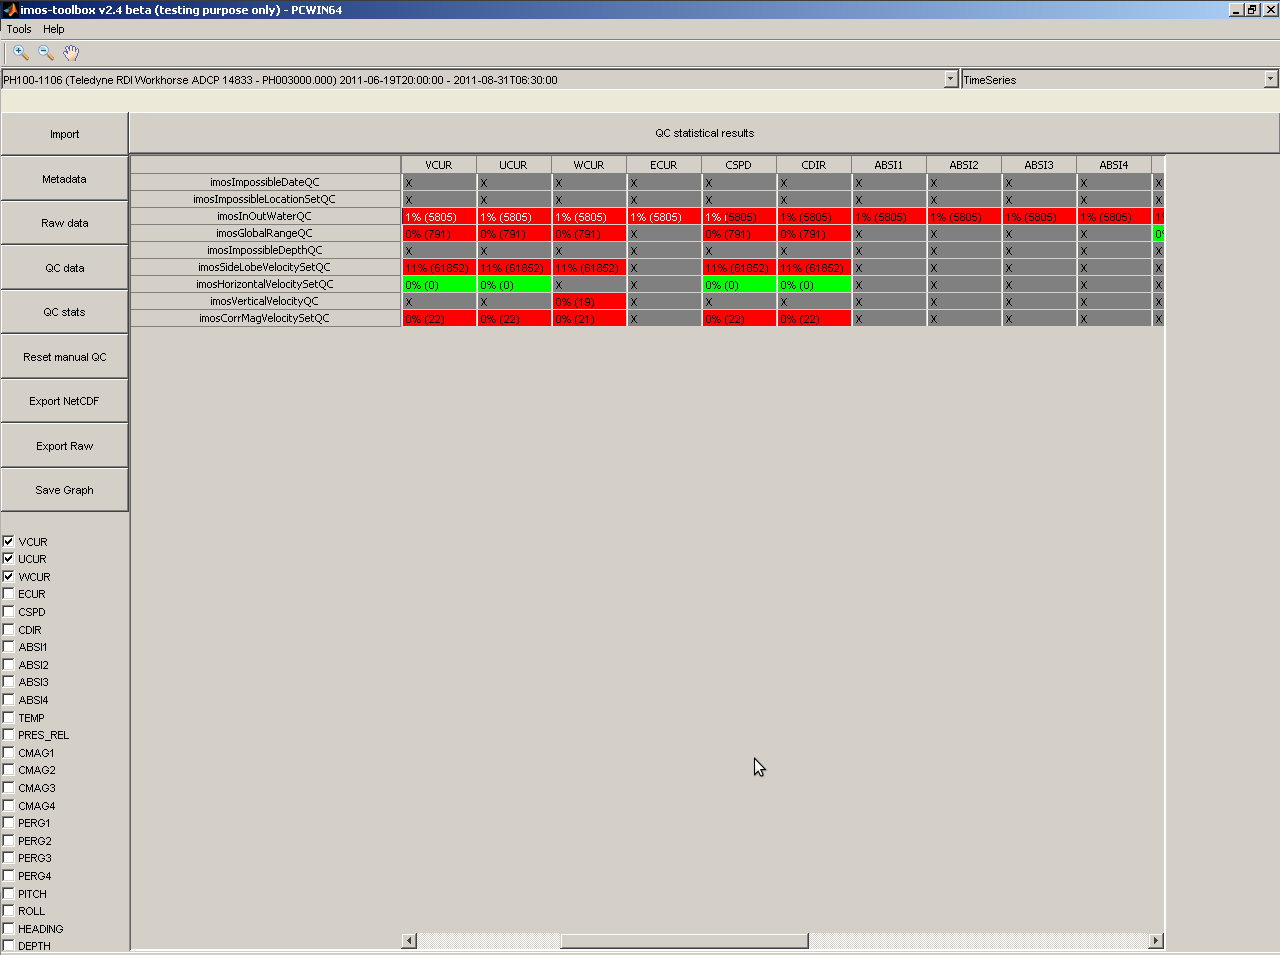
Clicking on a specific cell in the QC stat table displays the full details, procedure's parameters applied included:
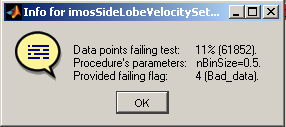
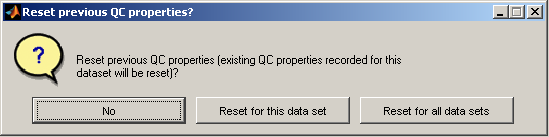
The different parameters in parameter files are recorded for each dataset in a .pqc file created next to the data file with the same root name. The first time a QC is ran, parameters are read from the .txt parameter files but then they will be read from the .pqc files so that specific parameters can be set and kept on a dataset basis for future re-processing.
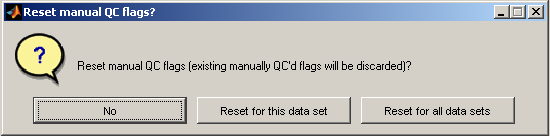
When running the QC again, a dialog window will pop up to ask the user whether he wants to reset these .pqc files or not before runing the QC:
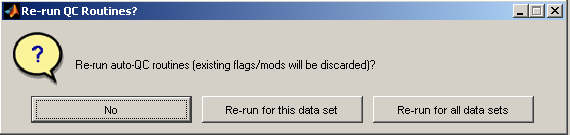
And then another pop up dialog to ask whether QC should be ran again or not. This is useful for tuning parameters on a specific dataset:
To manually QC some data samples, you can use click+drag a box to select them. Use the left mouse button to select all data points, and the right mouse button to select already-flagged data points. The selected data points are highlighted in white and a dialog, pops up allowing you to set the QC flag on those points, choose to apply these flags to additional parameters in the same dataset, and add some comment information on the reasons why a manual QC was necessary.
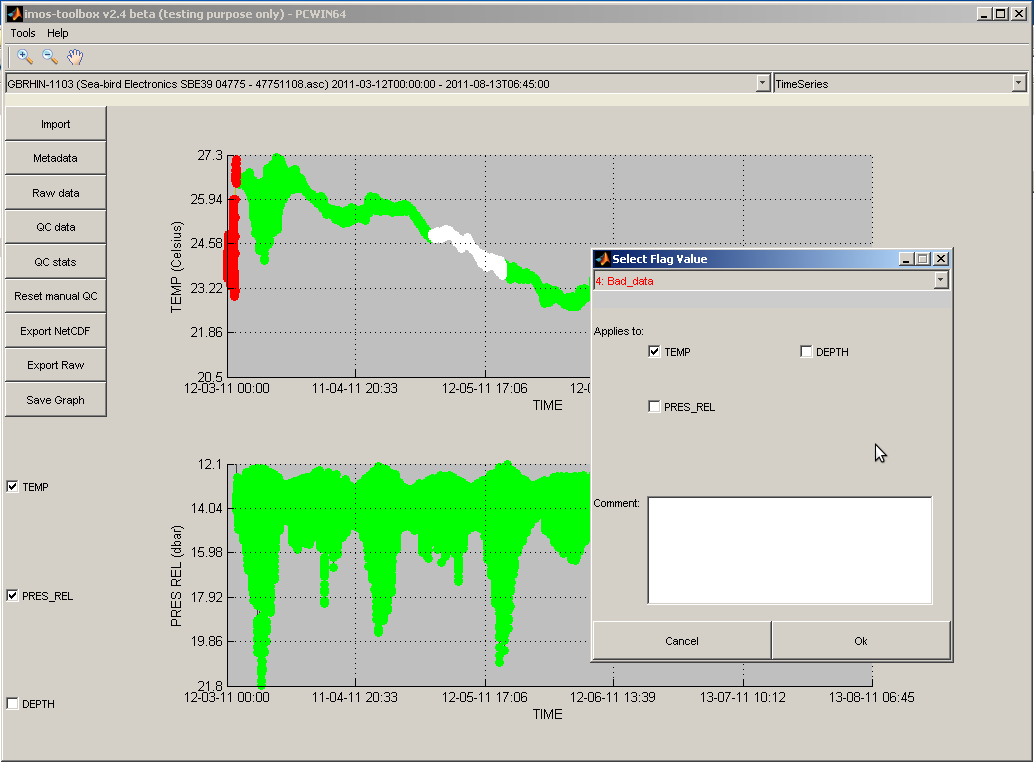
When you confirm the flag dialog, you will see that the flag values for the selected data points have changed.
The flags for each set of points are recorded for each dataset in a .mqc file created next to the data filw with the same root name. This is useful when re-processing so that the user don't have to manually QC again the data, instead the imosHistoricalManualSetQC test will read this file and set the flags where relevant. One can reset previous manual QC by deleting these .mqc files via the 'Reset manual QC' button:
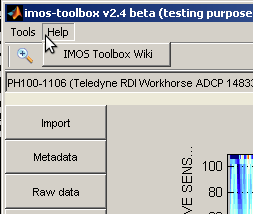
The menu panel can send you to this wiki for help:
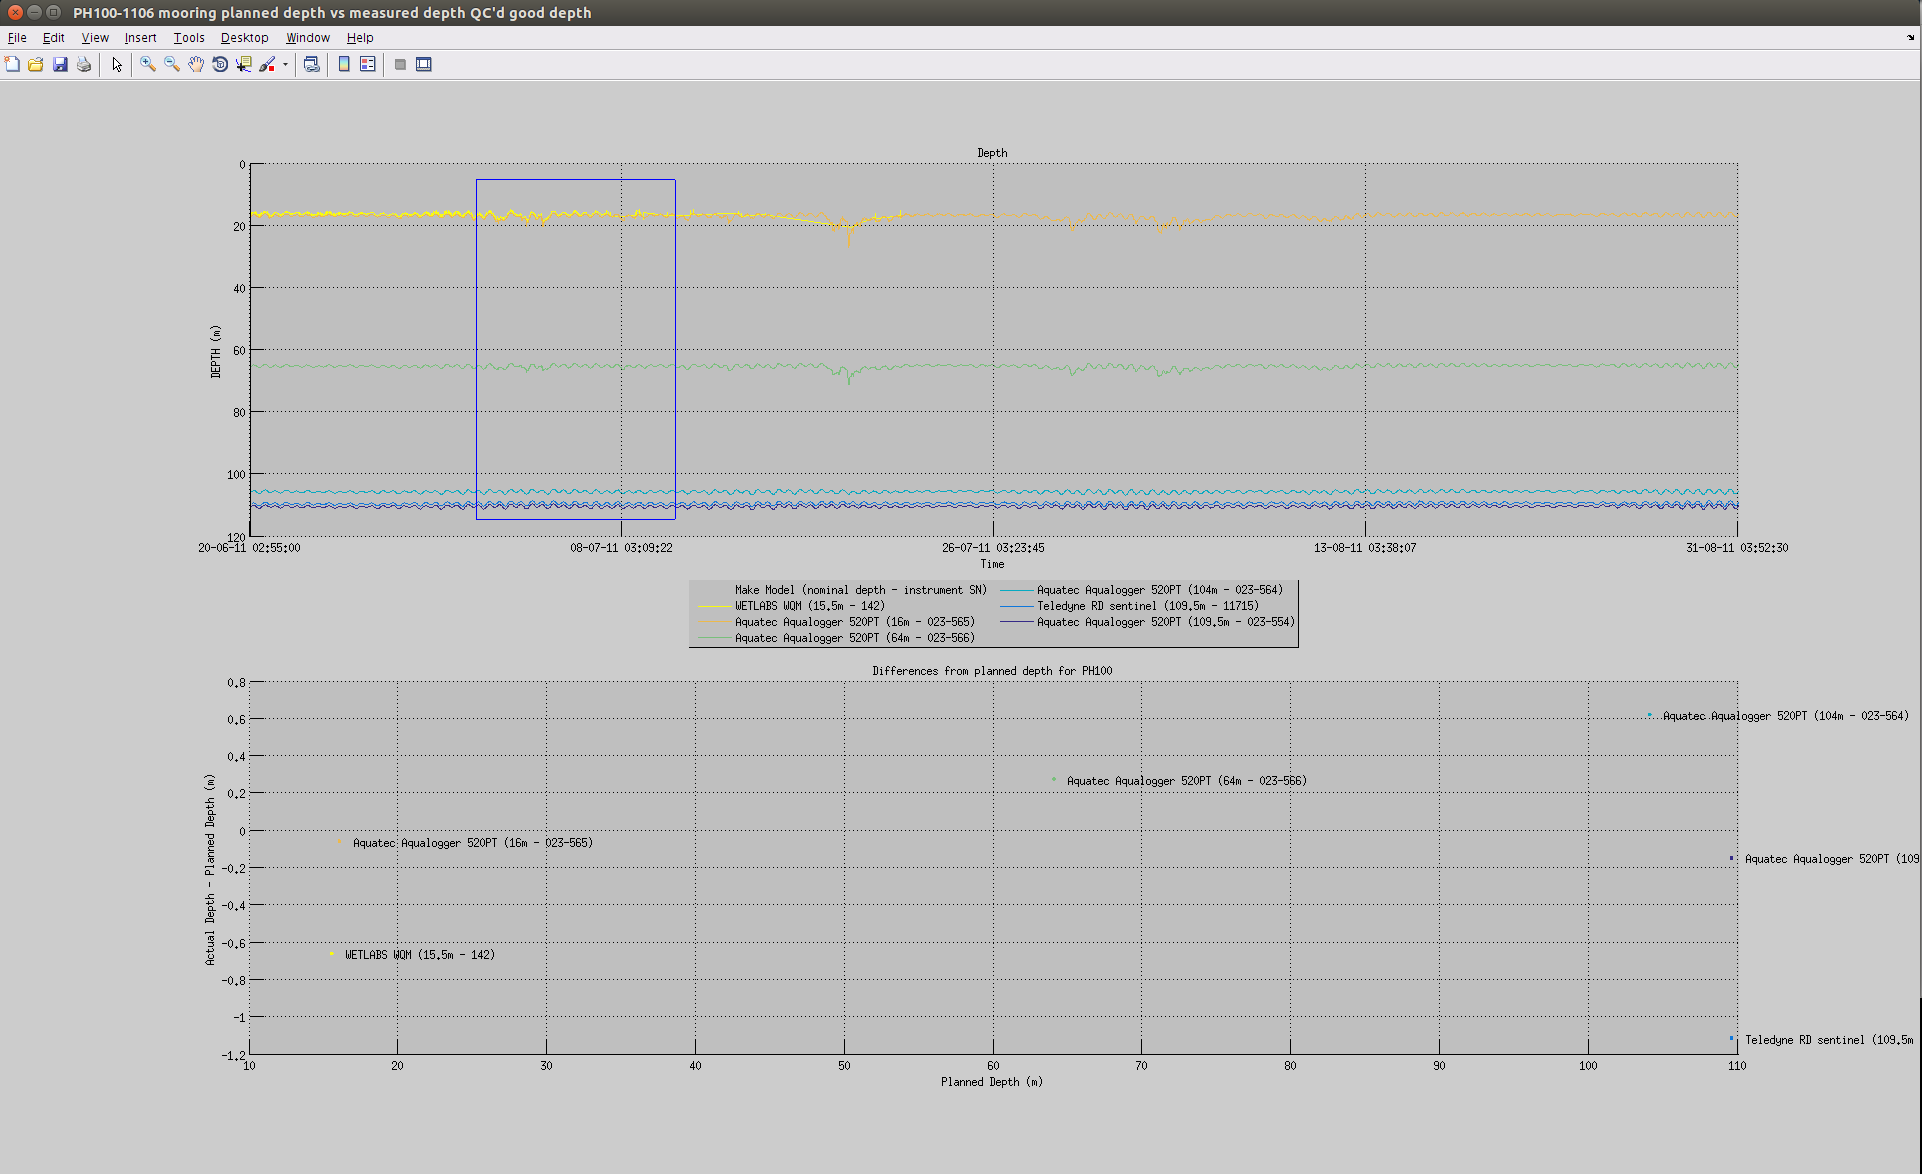
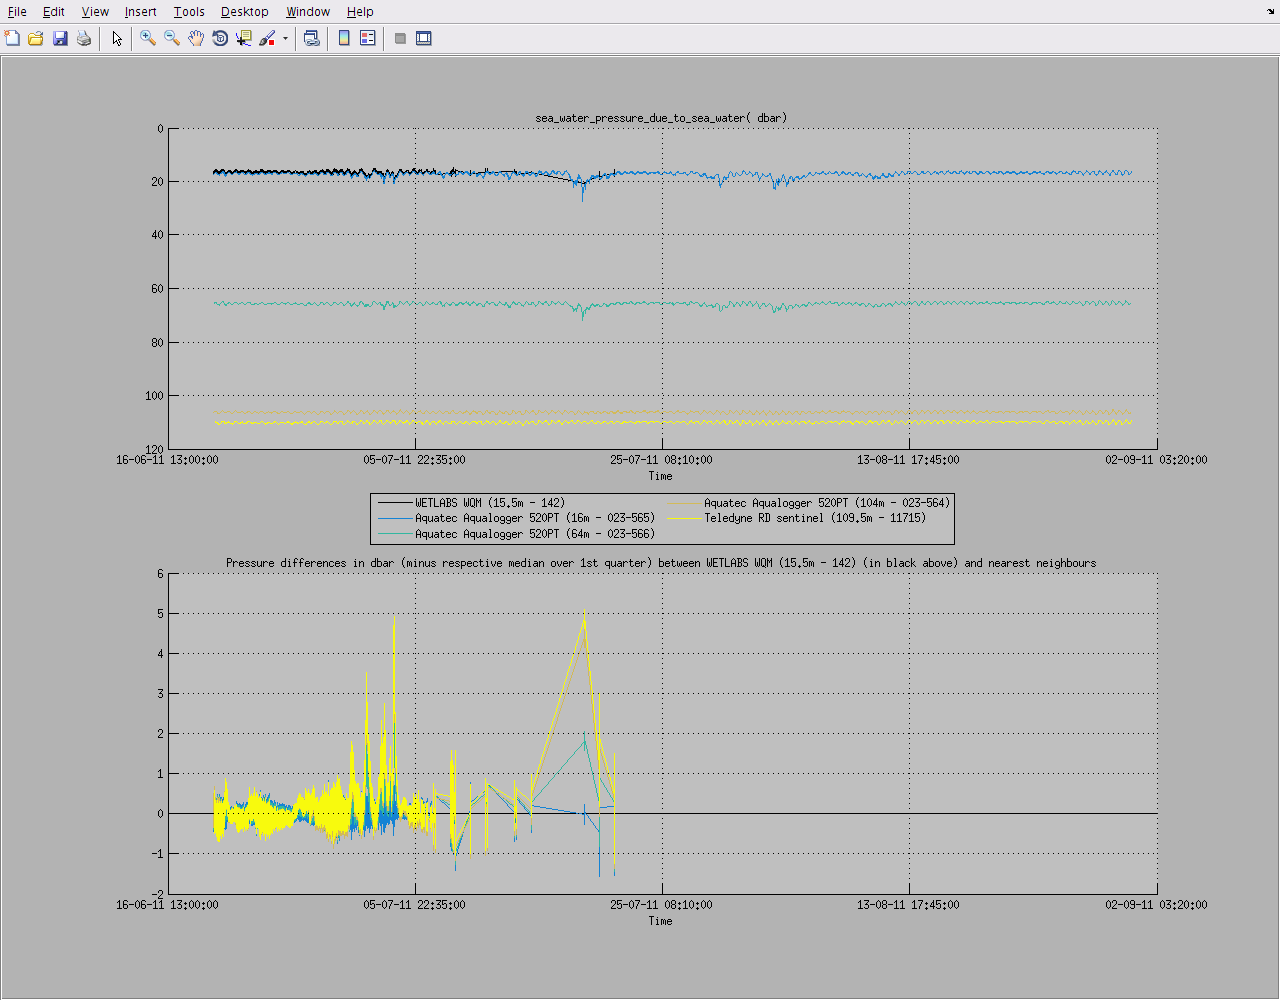
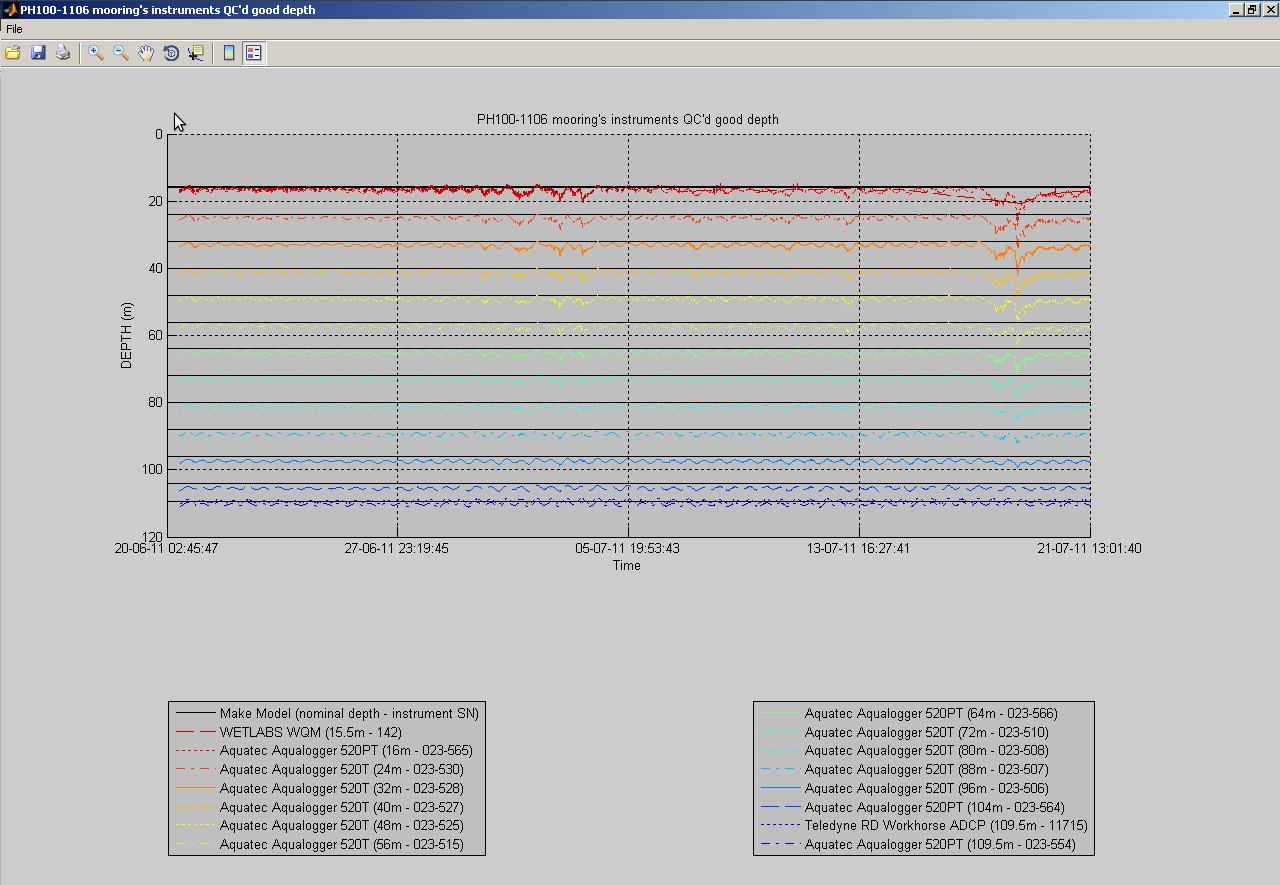
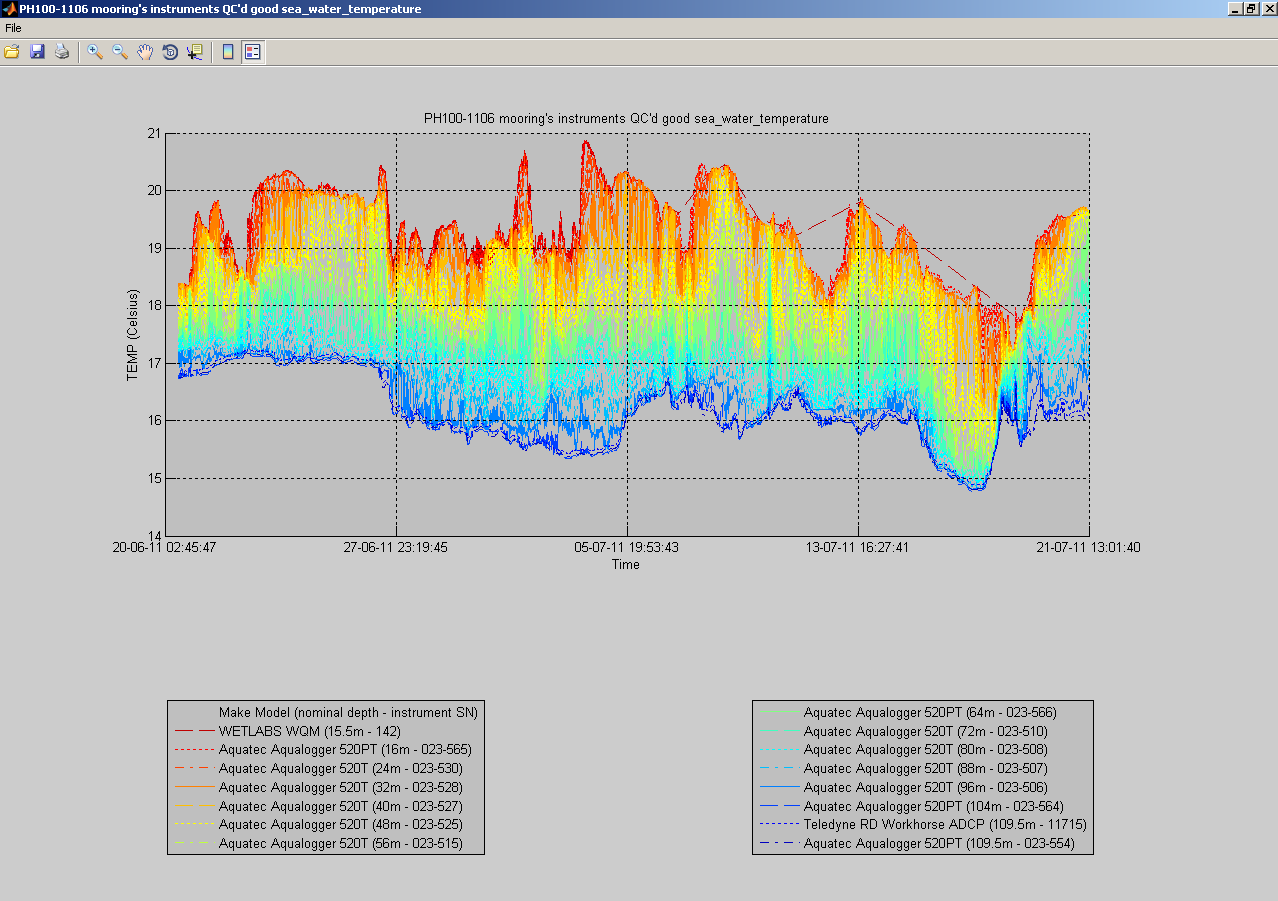
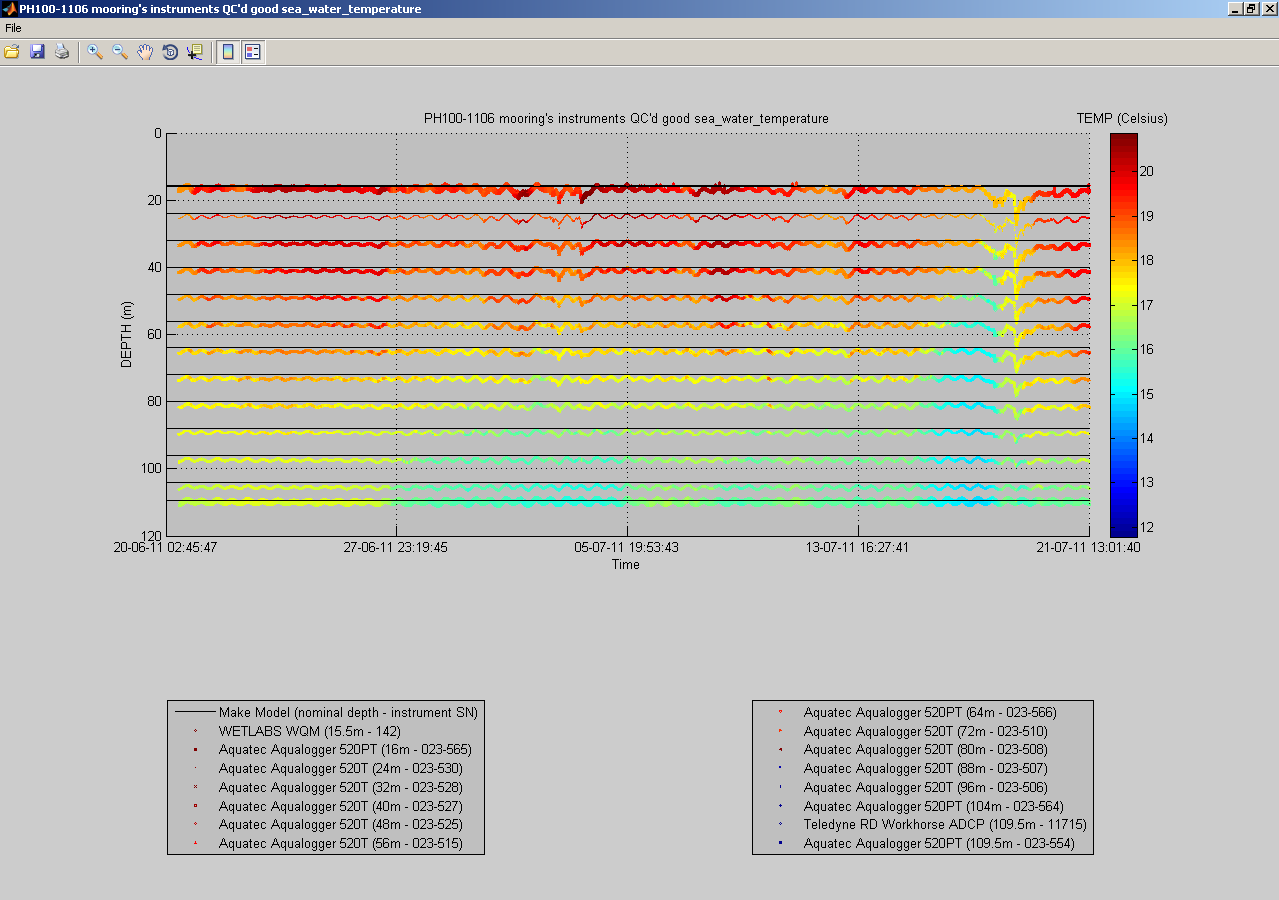
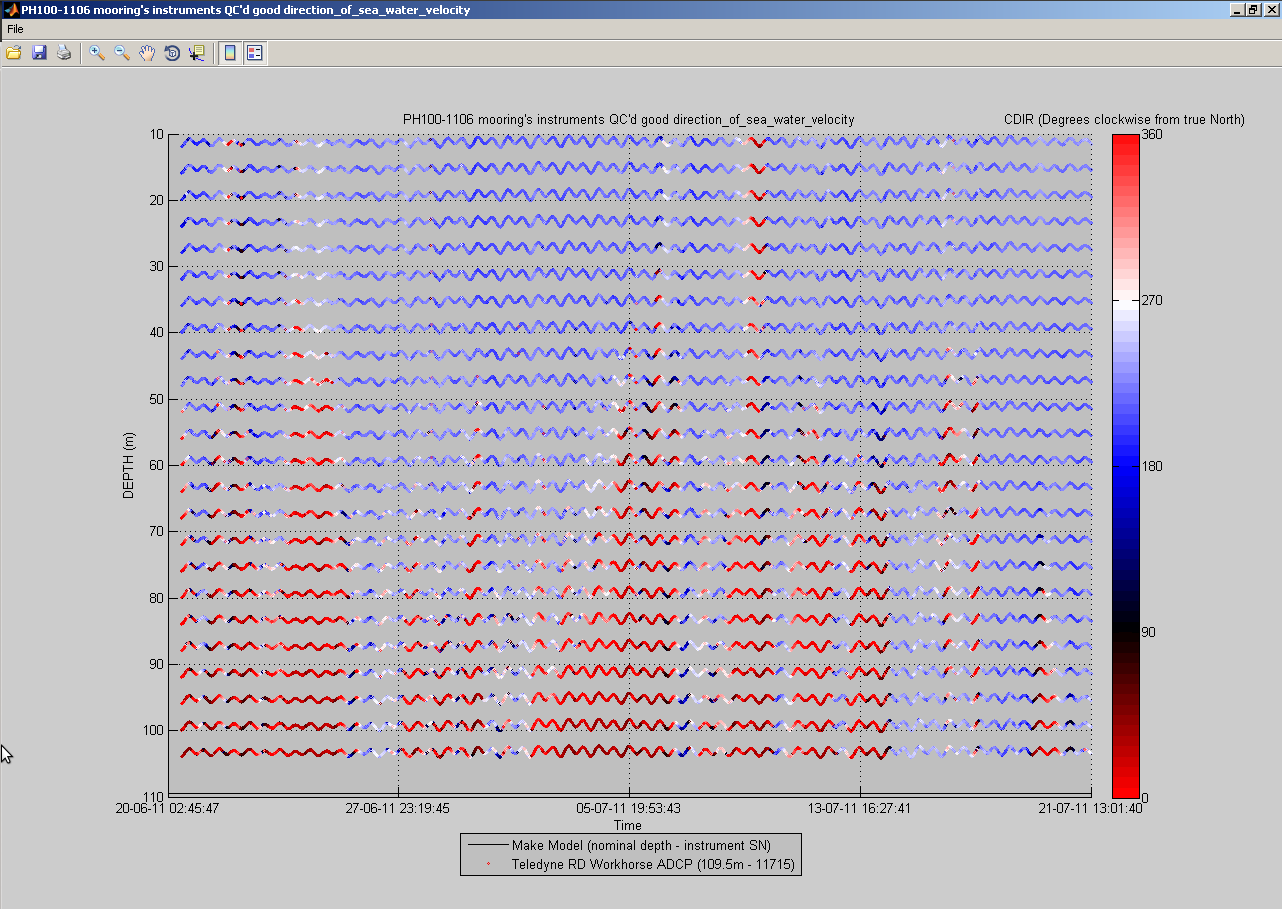
You can also plot a common variable accross all data sets of a mooring deployment on the same figure:
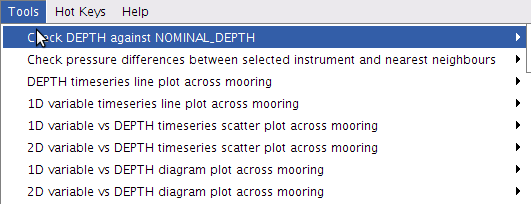
useful to monitor instruments measurements against each others:
At any time, you can click the 'Export NetCDF' button to export the data sets to IMOS compliant NetCDF files. You can choose to omit specific variables, and to export non QC'd data, QC'd data or both:
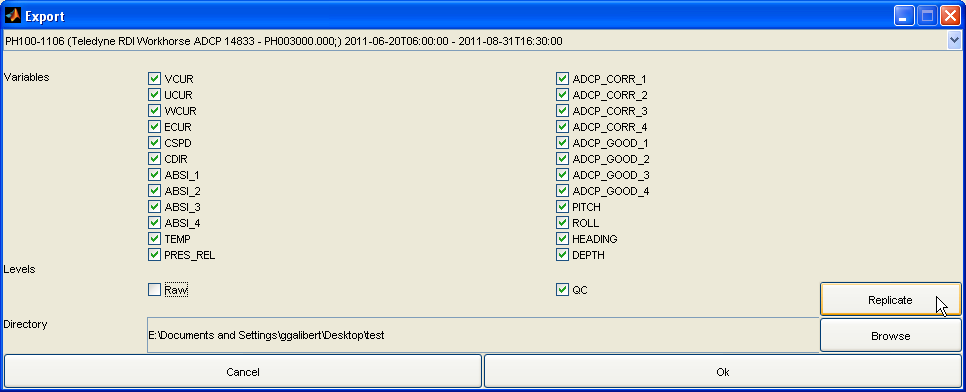
An export configuration (common variable(s) and/or QC level omited) can be replicated accross all the data sets from the current one being displayed by clicking on on the 'Replicate' button.
You will be presented with a similar dialog upon clicking the 'Export Raw' button, which allows you to copy the original raw data files, renamed with an IMOS compliant file name.