Basic usage
Verif is a command-line tool, which is run as follows:
verif <files> -m <metric> <options>where files refer to one or more specially formatted input files with forecast and observation data, metric is one of over 90 verification metrics and diagrams, and options are a combination of over 60 different flags that modify the output plot.
Verif sends data from the input files though a set of processing steps:

After input data is parsed, it is passed through optional anomaly, time aggregation, and filtering steps. Data is then stratified, scores computed, and finally visualized.
The first diagram we will look at is -m obsfcst, which plots observations and forecasts together. By default, this is shown as a function of lead-time where data is averaged across all locations and forecast dates. In this lead-time us the stratification dimension.
verif ECMWF.nc MEPS.nc -m obsfcstThis opens a graphical display like this:
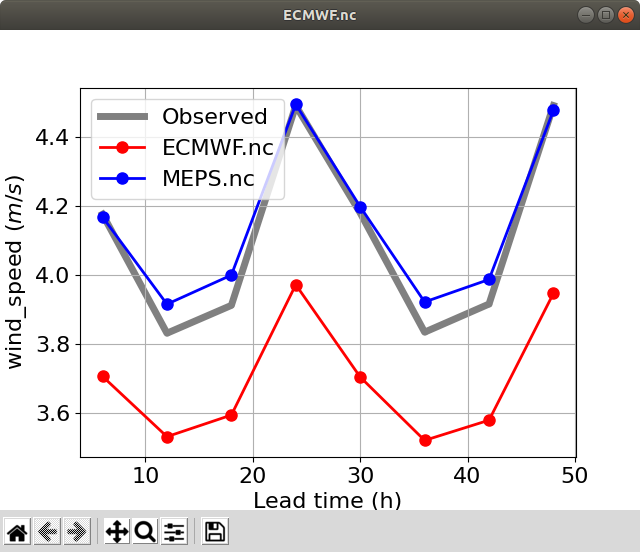
The plot can be adjusted interactively (check out this list of shortcuts).
To get a list of all available commands, run verif without any arguments. To get more information about a particular metric, run verif -m <metric> (i.e. without any input files).
Verif works with 3 dimensional data. One dimension relates to the initialization time of the forecasts. Forecasts can be initialized several times a day. The second dimension relates to the forecast lead time, that is how many hours into the future the forecast is valid for relative to the initialization time. Finally, the location dimension represents a set of locations in space. This can either be a set of point locations, or a 2D grid of locations serialized into a single dimension.
Verif can aggregate the values across these other dimensions, such as:
verif ECMWF.nc MEPS.nc -m obsfcst -x time
verif ECMWF.nc MEPS.nc -m obsfcst -x leadtime
verif ECMWF.nc MEPS.nc -m obsfcst -x location
verif ECMWF.nc MEPS.nc -m obsfcst -x lat
verif ECMWF.nc MEPS.nc -m obsfcst -x lon
verif ECMWF.nc MEPS.nc -m obsfcst -x elev
verif ECMWF.nc MEPS.nc -m obsfcst -x no
For example, if -x time is selected, then the average observation is computed across all lead-times and locations separately for each forecast initialization date. The default dimension is -x leadtime. The option -x no specifies no aggregation dimension, meaning that all values are aggregated into one number. The plot turns into a bar graph, with one bar for each input.
The date dimension can be further aggregated by averaging all dates within (for example) each week:
verif ECMWF.nc MEPS.nc -m obsfcst -x timeofday
verif ECMWF.nc MEPS.nc -m obsfcst -x day
verif ECMWF.nc MEPS.nc -m obsfcst -x week
verif ECMWF.nc MEPS.nc -m obsfcst -x month
verif ECMWF.nc MEPS.nc -m obsfcst -x year
-x timeofday slices the dataset based on what time of day each forecast was initialized on (not the time of day the forecast was valid for).
By default, the average is taken when aggregating data across dimensions, however Verif supports the following aggregators:
- mean
- median
- min
- max
- std (standard deviation)
- variance
- absmean (absolute value of the mean)
- meanabs (mean value of absolute values)
- range (max minus min)
- sum
- count (number of valid points)
- iqr (inter quartile range)
- quantile (specified by a number between 0 and 1)
The aggregator will work in combination with the specified dimension (-x). Some examples are:
verif ECMWF.nc MEPS.nc -m obsfcst -agg median
verif ECMWF.nc MEPS.nc -m obsfcst -agg max -x location
verif ECMWF.nc MEPS.nc -m obsfcst -agg 0.9 -x month
Quantiles are specified by using any number between 0 and 1, as in the example above. Note that not every metric supports this option. For example, -m corr does not support this as there is no natural way that an aggregator can be used in the calculation of correlation.
To see what is available in the files, run one or more of the following:
verif ECMWF.nc MEPS.nc --list-times
verif ECMWF.nc MEPS.nc --list-dates
verif ECMWF.nc MEPS.nc --list-locations
verif ECMWF.nc MEPS.nc --list-quantiles
verif ECMWF.nc MEPS.nc --list-tresholdsBy default, Verif plots graphs, however you can use the -type options to plot data on a map or export to text. To plot the average observed values on a map use:
verif ECMWF.nc MEPS.nc -m obs -type map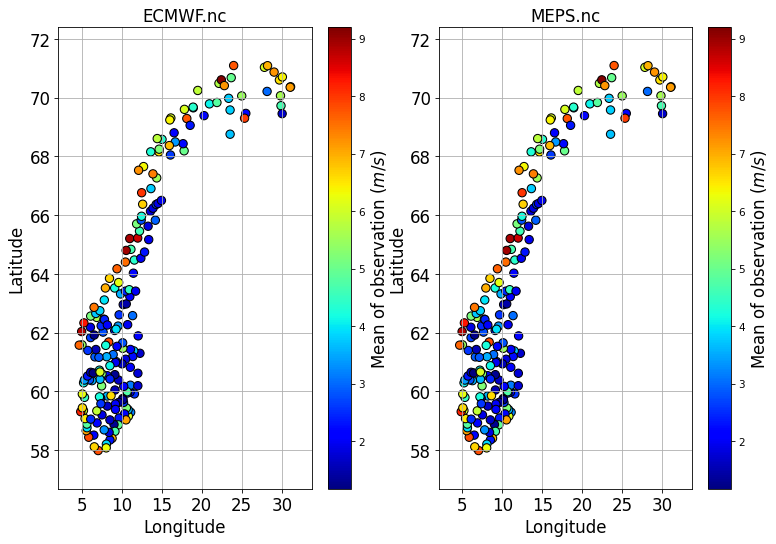
Maps automatically imply -x location (as values are aggregated for each location), though this does not need to be specified. Note that not every metric specified by -m (such as -m obsfcst) supports the map option. More info about the map option can be found here.
To create formatted text output, use -type text:
verif ECMWF.nc MEPS.nc -m obsfcst -type text

Leadtime            | obs        | ECMWF.nc   | MEPS.nc    |
6                   | 4.175      | 3.706      | 4.167      |
12                  | 3.831      | 3.531      | 3.915      |
18                  | 3.912      | 3.594      | 3.999      |
24                  | 4.49       | 3.971      | 4.493      |
30                  | 4.179      | 3.704      | 4.197      |
36                  | 3.834      | 3.521      | 3.921      |
42                  | 3.915      | 3.579      | 3.987      |
48                  | 4.49       | 3.946      | 4.476      |
or comma-separated output, use -type csv:
verif ECMWF.nc MEPS.nc -m obsfcst -type csv

Leadtime,obs,ECMWF.nc,MEPS.nc
6.0,4.17528,3.70597,4.1672
12.0,3.83089,3.53139,3.91493
18.0,3.91156,3.59399,3.99921
24.0,4.48983,3.97132,4.49338
30.0,4.17913,3.70398,4.19714
36.0,3.83393,3.52058,3.92138
42.0,3.91543,3.57911,3.9865
48.0,4.49008,3.94635,4.47609By default, the plot is shown in a graphical window that pops up. Verif can also save the image directly to file using the -f flag:
verif ECMWF.nc MEPS.nc -m obsfcst -f image.png -fs 10,5 -dpi 300The file extension determines what type of image is saved. Verif will recognize standard file types such as pdf, gif, jpeg, png, eps, ps, svg, and tiff. The size of the figure is set by -fs width,heigh (in inches). The default resolution is 100 dots per inch, but this can be overridden by the -dpi flag.
When -type text or -type csv is chosen, then -f will write the text to file. Any file extension can be used as the extension is not used to determine how to write the file.
To enforce a fair comparison when comparing multiple input files, verification scores are only computed on locations, dates, and leadtimes that are common to all input files. If one file is missing a location, then that location will not be included in any of the verification scores. This is to ensure that the comparison is fair. Otherwise, one input could potentially receive a better score because it included certain locations or dates that are easier to forecast.
When Verif loads the two files, it eliminates locations, dates, and leadtimes that are not common to both files. It also eliminates individual forecast values if one of the input files has a missing value for a particular location/date/leadtime.
If input1.nc and input2.nc contain different locations/dates/leadtimes, then the following two commands will likely show different scores for input1 since different subsets of the data are used in the calculation:
verif input1.nc input2.nc -m mae
verif input1.nc -m mae