-
Notifications
You must be signed in to change notification settings - Fork 37
Rank plots
Thomas Nipen edited this page May 19, 2023
·
6 revisions
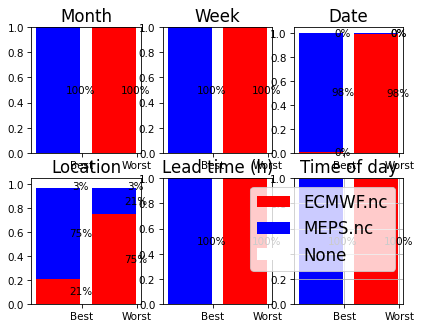
In some cases, aggregate forecast errors are dominated by a few poor forecasts. A good forecast system should be good a high percentage of times. It should also be better for a majority of locations. To assess how often one forecast system is better than the other, use the -type rank option. The following shows the frequency that each system is best for different dimensions:
verif ECMWF.nc MEPS.nc -m corr -type rank -x all
By selecting -x all, a subplot is created for each of 6 dimension. To only show one subplot, specify the desired dimension using -x.
The rank information can also be shown on a map:
verif ECMWF.nc MEPS.nc -m corr -type maprank -maptype simple
- Introduction
- Installation
- Basic usage
- Metrics and diagrams
- Visualization options
- Data manipulation options
- Datasets
- Other