-
Notifications
You must be signed in to change notification settings - Fork 37
Probabilistic verification
Reliability diagram • Brier score and its decomposition • Brier skill score • Economic value • Spread-skill diagram • Discrimination diagram • Murphy diagram • PIT-histogram • CRPS
Probabilistic verification requires the input files to contain exceedance probabilities for thresholds, or quantile forecasts. To see which thresholds and quantiles are available in your inout files, use:
verif ECMWF.nc MEPS.nc --list-thresholds --list-quantilesThe following metrics and diagrams require one or more thresholds or quantiles, which are specified using -r and -q respectively.
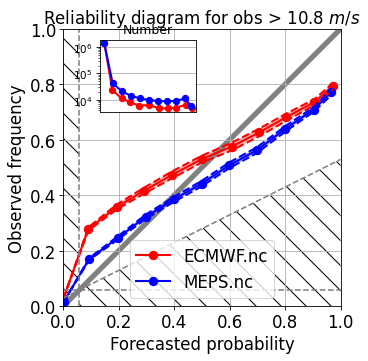
The reliability diagram requires a single threshold, which must be specified using -r. To see a reliability diagram for the 2 mm threshold, use:
verif ECMWF.nc MEPS.nc -m reliability -r 10.8
As mentioned earlier, -b below can be used to show the reliability diagram for observations below the threshold instead. To create a simpler graph that does not show the bin frequency and the uncertainty bands, use -simple. To set what probability bins are shown, use -q (for example -q 0:0.05:1).
verif ECMWF.nc MEPS.nc -m bs
If no thresholds are specified, then all thresholds available as CDFs in the input files are used.
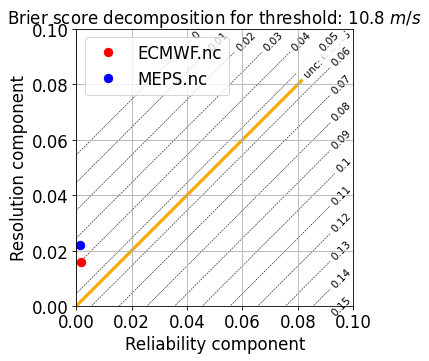
The Brier score decomposed into reliability, resolution, and uncertainty terms can be computed using:
verif ECMWF.nc MEPS.nc -m bsrel -r 10.8
verif ECMWF.nc MEPS.nc -m bsres -r 10.8
verif ECMWF.nc MEPS.nc -m bsunc -r 10.8
These components can be visualized in a Brier score decomposition diagram. It plots the reliability component on the x-axis, and the resolution component on the y-axis. The diagonal lines represents the total Brier score. The yellow line represents the uncertainty. Forecasts below the yellow lines do not have any skill relative to climatology.
verif ECMWF.nc MEPS.nc -m bsdecomp -r 10.8 
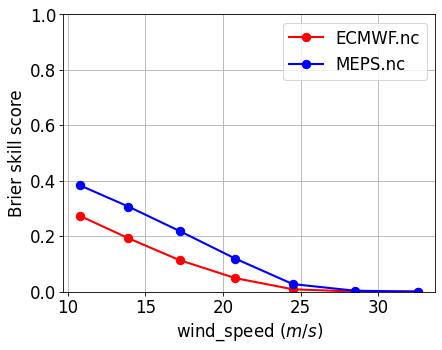
The Brier skill score is the fractional improvement of the Brier score relative to a climatological reference forecast (we have used the uncertainty for this):
verif ECMWF.nc MEPS.nc -m bss
The contribution of reliability and resolution to the brier skill score can be computed using:
verif ECMWF.nc MEPS.nc -m bssrel -r 10.8
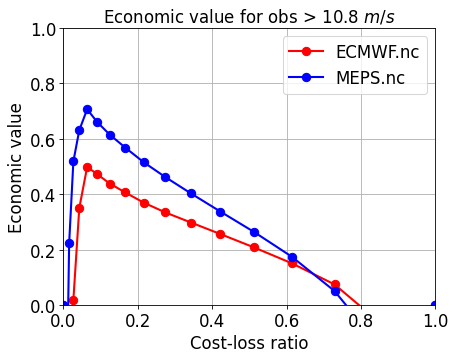
verif ECMWF.nc MEPS.nc -m bssres -r 10.8verif ECMWF.nc MEPS.nc -m economicvalue -r 10.8
The spread of a forecast's distribution should be an indicator of how skillful the (median of the) forecast is. A narrow distribution should correspond to forecasts that are more skilled. To check this, the spreadskill diagram can be used:
verif ECMWF.nc MEPS.nc -m spreadskill -sp
Verif uses the quantile information in the files. As spread it will use the width of the largest quantiles available. In this case it is the width between the 10th and 90th percentile. As skill, Verif uses the RMSE of the median of the distribution. To change which quantiles are used, use -q. As with some other metrics, this diagram bins the x-axis, and the edges can be specified using -r.
The ideal line (-sp) shows the expected RMSE of a Gaussian variable with the given width.
verif ECMWF.nc MEPS.nc -m discrimination -r 10.8
Available in v1.3. See https://arxiv.org/abs/2301.10803 for more details.
verif ECMWF.nc MEPS.nc -m murphy -r 10.8
The PIT histogram shows if the observation tends to fall evenly across different quantiles in the forecast distributions. It is analogous to the rank histogram for ensembles. Use the -m pithist to plot the PIT-histogram. The example dataset does not contain the PIT values and therefore this diagram cannot be shown. The -r option sets the edges for the bins.
The continuous ranked probability score can be computed in two ways.
- Precompute CRPS on your own and include it as a variable in the input files. If the field is called 'crps', then use the following:
verif file.nc -m crpsAny name can be used for these pre-computed fields, but it has to match the name used after -m and it cannot be the name of an existing metric (e.g. rmse).
- Use the Brier score for multiple thresholds.
- Introduction
- Installation
- Basic usage
- Metrics and diagrams
- Visualization options
- Data manipulation options
- Datasets
- Other