-
Notifications
You must be signed in to change notification settings - Fork 235
Challenges of Custom Cache Implementation in Netty Based Streaming Systems: Memory Fragmentation and OOM Issues
Kafka, as a stream processing platform, aims for end-to-end low latency in real-time stream computation and online business scenarios. In offline batch processing and peak shaving scenarios, it seeks high throughput for cold reads. Both scenarios require a well-designed data caching mechanism to support them. Apache Kafka stores data in local files and accesses them by mapping files into memory using mmap, naturally leveraging the operating system for file buffering, cache loading, and cache eviction.
AutoMQ adopts a separation of storage and computation architecture, where storage is offloaded to object storage. With no local data files, it cannot directly use mmap for data caching like Apache Kafka. At this point, there are usually two approaches to cache data from object storage:
-
The first approach is to download object storage files to local files and then read the local files using mmap. This approach is relatively simple to implement but requires additional disk space to cache data. Depending on the size and rate of the cache required, it also necessitates purchasing disk space and IOPS, making it economically inefficient.
-
The second approach is to directly use memory for data caching based on the data consumption characteristics of stream processing. This method is more complex to implement, essentially requiring the creation of a memory management system similar to an operating system. However, like everything in life has its pros and cons, implementing memory cache management oneself allows for achieving the best caching efficiency and cost-effectiveness based on business scenarios.
To reduce operational complexity and holding costs, and to improve cache efficiency, AutoMQ ultimately chose the second approach: "directly using memory for data caching."
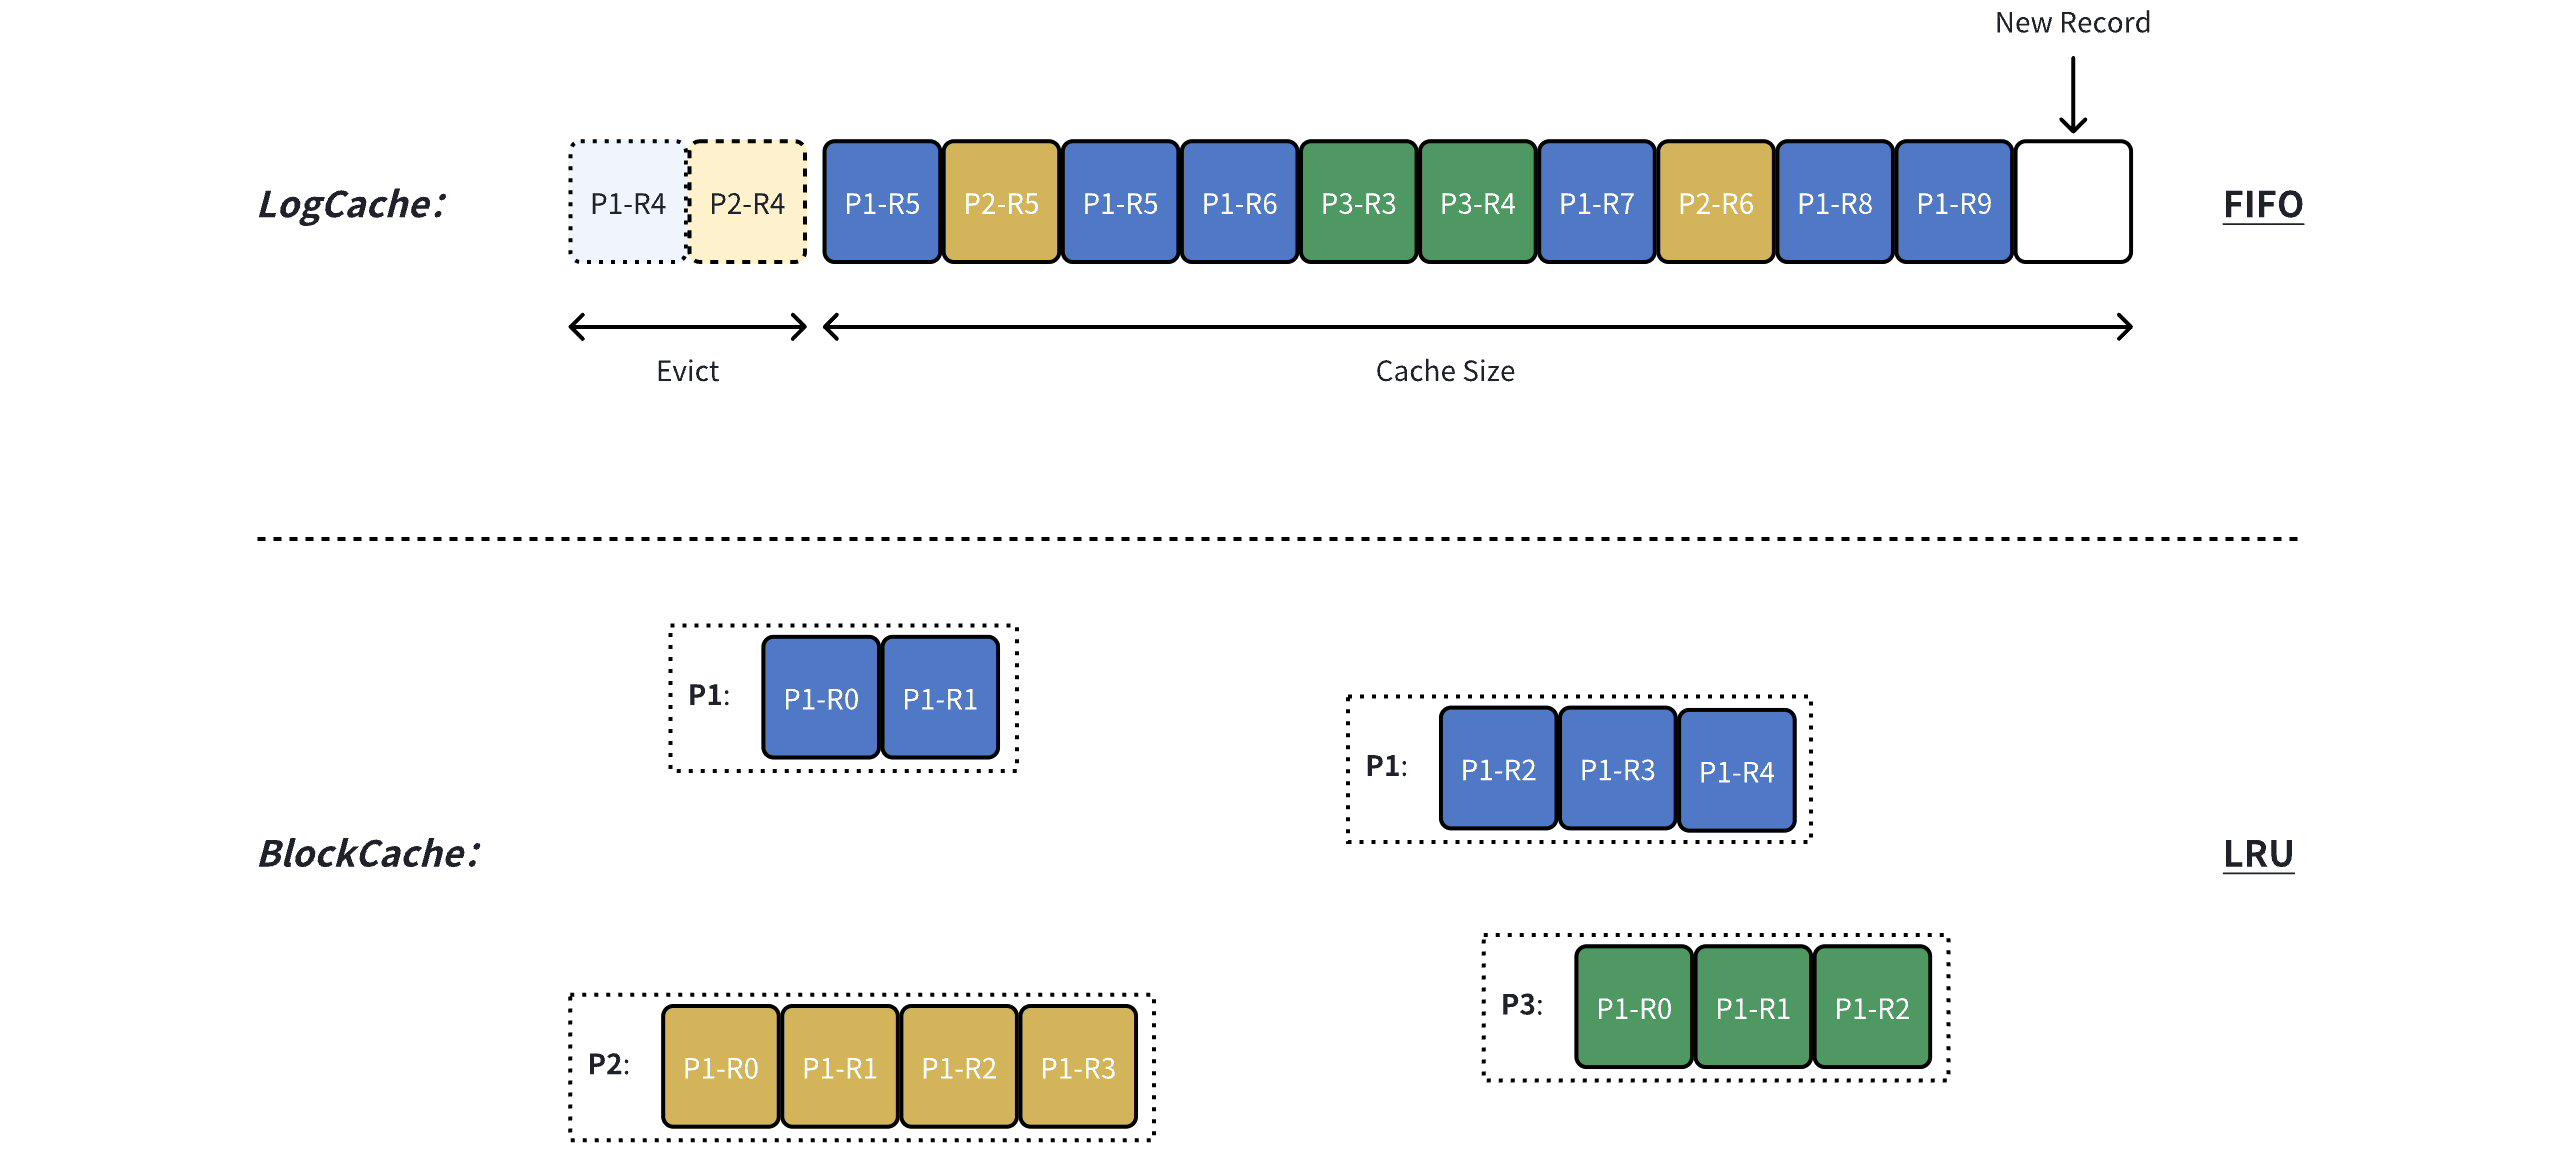
Directly leveraging memory for data caching, AutoMQ has designed two caching mechanisms for tail read and cold read scenarios based on their data access characteristics: LogCache and BlockCache.
LogCache is designed for the tail read scenario. When data is uploaded to object storage, it is simultaneously cached in LogCache as a single RecordBatch. This allows hot data to be accessed directly from the cache, providing extremely low end-to-end latency. Compared to general-purpose OS cache designs, LogCache has the following two features:
-
FIFO: Given the characteristic of continuous access to new data in tail read scenarios, LogCache uses a First In, First Out eviction policy to ensure the availability of the cache for new data.
-
Low Latency: LogCache has a dedicated cache space solely responsible for caching hot data, avoiding the problem of cold data reads affecting hot data consumption.
BlockCache is designed for cold read scenarios. When the required data cannot be accessed in LogCache, it is read from BlockCache. Compared to LogCache, BlockCache has the following two distinctions:
-
LRU: BlockCache uses the Least Recently Used eviction strategy, which offers better cache utilization in high fan-out cold read scenarios.
-
High Throughput: Cold read scenarios focus on throughput; therefore, BlockCache reads and caches data in large chunks (~4MB) from object storage and uses a prefetching strategy to load data that is likely to be read next.
In Java programs, data can be cached in memory using either on-heap or off-heap memory. To alleviate the burden on JVM GC, AutoMQ uses off-heap Direct Memory for caching data. To improve the efficiency of Direct Memory allocation, it employs the industry-standard Netty PooledByteBufAllocator for memory allocation and release from a pooled memory.
The expectation was that by using Netty's PooledByteBufAllocator, AutoMQ could achieve efficient memory allocation speed through pooling, along with a well-honed memory allocation strategy to minimize overhead, providing peace of mind. However, during the performance testing of AutoMQ 1.0.0 RC, reality hit hard.
AutoMQ was deployed on a 2C16G production model, with an off-heap memory limit set to 6GiB using -XX:MaxDirectMemorySize=6G. Memory allocation was set as 2GiB for LogCache + 1GiB for BlockCache + 1GiB for other small items, totaling ~4GiB, which is less than 6GiB. In theory, there was ample off-heap memory available. However, in practice, after running AutoMQ 1.0.0 RC for an extended period under various loads, an OutOfMemoryError (OOM) was encountered.
Following the principle of suspecting our own code before suspecting mature libraries and operating systems.
Upon observing the exception, the initial suspicion was whether there was a missed ByteBuf#release call in the code. Hence, the Netty leak detection level was set to -Dio.netty.leakDetection.level=PARANOID to check if any ByteBuf instances were being garbage collected without being released. After running for a while, no leak logs were found, ruling out the possibility of missed releases.
Next, the suspicion shifted to whether any part of the code was allocating more memory than expected. Netty's ByteBufAllocatorMetric only provides global memory usage statistics, and traditional memory allocation flame graphs only offer memory request amounts at specific times. What we needed was the memory usage of various types at a given moment. Therefore, AutoMQ consolidated ByteBuf allocation into a custom ByteBufAlloc factory class, using WrappedByteBuf to track memory requests and releases of various types. This allowed us to record the memory usage of different types at any given moment and also record Netty's actual memory usage, thereby providing insight into AutoMQ's overall and categorized memory usage.
Buffer usage:
ByteBufAllocMetric{allocatorMetric=PooledByteBufAllocatorMetric(usedDirectMemory: 2294284288; ...), // Physical Memory Size Allocated by Netty
allocatedMemory=1870424720, // Total Memory Size Requested By AutoMQ
1/write_record=1841299456, 11/block_cache=0, ..., // Detail Memory Size Requested By AutoMQ
pooled=true, direct=true} (com.automq.stream.s3.ByteBufAlloc)
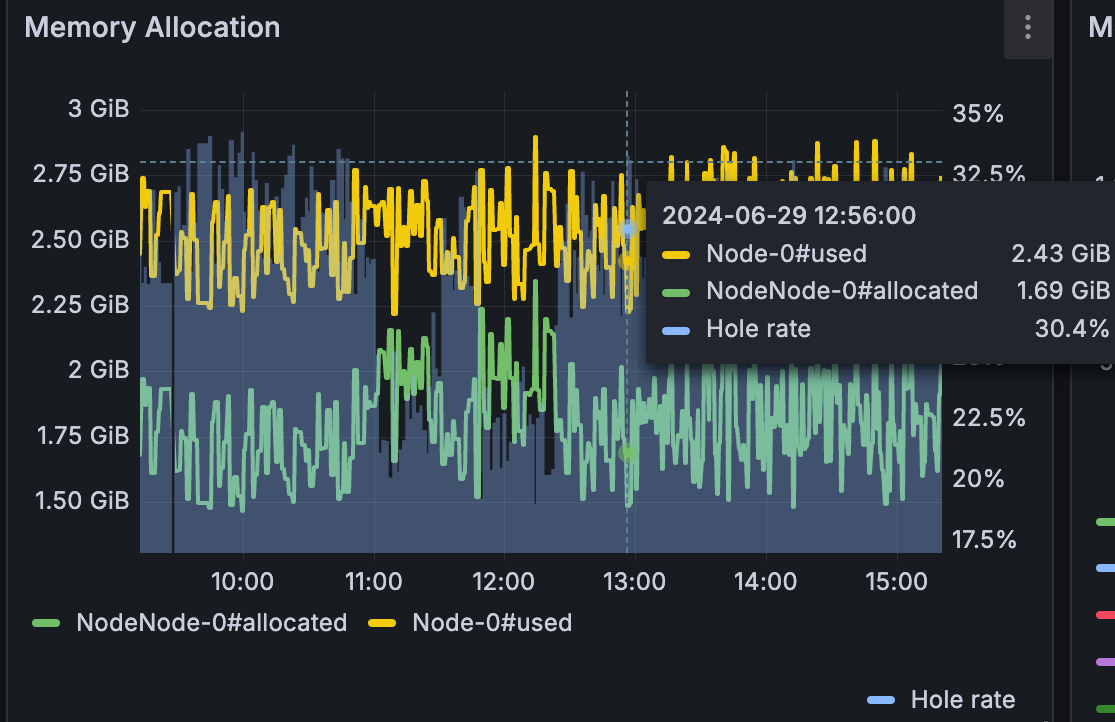
After adding categorized memory statistics, it was found that the memory usage of various types was within the expected range. However, it was observed that there was a significant discrepancy between the memory requested by AutoMQ and the actual memory allocated by Netty. This discrepancy grew over time, sometimes even resulting in Netty's actual memory usage being twice that of AutoMQ's requested memory. This discrepancy was identified as memory fragmentation in memory allocation.
Ultimately, the cause of the OOM was identified as memory fragmentation in Netty's PooledByteBufAllocator. Having initially identified the problem, the next step was to understand why Netty had memory fragmentation and how AutoMQ could mitigate this issue.
First, let's explore the causes of Netty's memory fragmentation. Netty's memory fragmentation can be divided into internal fragmentation and external fragmentation:
-
Internal Fragmentation: This type of fragmentation occurs due to size standardization alignment. For example, when you expect to allocate 1 byte, but the underlying system actually occupies 16 bytes, leading to an internal fragmentation waste of 15 bytes.
-
External Fragmentation: Simply put, any fragmentation caused by factors other than internal fragmentation is considered external fragmentation. This usually results from memory layout fragmentation caused by allocation algorithms.
Internal and external fragmentation exhibit different behaviors in different versions of Netty. Below, we will briefly introduce the working mechanisms and causes of memory fragmentation for the Buddy Allocation Algorithm and the PageRun/PoolSubPage Allocation Algorithm, using Netty version 4.1.52 as a dividing line.
Netty versions prior to 4.1.52 use the Buddy Allocation Algorithm, which originates from jemalloc3. To improve memory allocation efficiency, Netty requests a contiguous chunk of memory (PoolChunk) from the operating system at once. When a ByteBuf is requested from the upper layer, this chunk of memory is logically divided and returned as needed. The default size of a PoolChunk is 16MB, which is logically divided into 2048 pages, each 8KB in size. The memory usage is represented by a complete binary tree.
Each node in the complete binary tree uses one byte to represent the node's state (memoryMap):
-
The initial value represents the number of layers, with the status value == number of layers indicating that the node is completely idle.
-
When the number of layers < status value < 12, it means that the node is partially used but still has remaining space.
-
When the status value == 12, it means that the node has been fully allocated.
Memory allocation is divided into four types: Tiny [0, 512 bytes], Small (512 bytes, 8KB), Normal [8KB, 16MB], and Huge (16MB, Max). Tiny and Small are managed by PoolSubpage, Normal is managed by PoolChunk, and Huge is allocated directly.
First, let's look at the allocation efficiency of small memory blocks. Tiny [0, 512 bytes] and Small (512 bytes, 8KB) divide a Page into equally sized logical blocks through PoolSubpage, with a bitmap marking the usage of these blocks:
-
The basic unit of Tiny memory allocation is 16 bytes, meaning if the requested size is 50 bytes, 64 bytes are actually allocated, resulting in an internal fragmentation rate of 28%.
-
The basic unit of Small memory allocation is 1KB, meaning if the requested size is 1.5KB, 2KB are actually allocated, resulting in an internal fragmentation rate of 25%.
Next, let's examine the allocation of medium-sized memory blocks, Normal [8KB, 16MB]. Suppose we request 2MB + 1KB = 2049KB from a completely idle PoolChunk:
-
2049KB normalized upwards to 4MB using base 2, thus targeting a Depth-3 free node.
-
Check node at index=1, find it free, then check the left subtree.
-
Check node at index=2, find it free, then continue checking the left subtree.
-
Check node at index=4, find it unallocated, mark the state of index=4 as 12, and update the parent node's state to the smallest of its children, thus changing the state of index=2 to 3, similarly updating parent nodes' states in succession.
-
Allocation completed.
From the allocation result, we can see that requesting 2049KB of memory actually marks 4MB as occupied, implying an internal fragmentation rate of 49.9%.
Suppose another 9MB memory is requested. Although the previous PoolChunk still has 12MB of remaining space, due to the Buddy memory allocation algorithm, index=1 is partially occupied, requiring a new PoolChunk to allocate 9MB of memory. The resulting external fragmentation rate is 1 - (4MB + 9MB) / 32MB = 59.3%. The effective memory utilization rate, which is the required memory / actual underlying occupied memory, is only 34.3%.
Furthermore, in scenarios of continuous allocation and release of variously sized memory blocks, even if the PoolChunk doesn't allocate a large space, it might be logically fragmented by scattered memory blocks, leading to increased external memory fragmentation . As shown in the figure below, although the upper-layer application ultimately retains only 4 * 8KB, it is no longer possible to request 4MB of memory from this PoolChunk.
Netty >= 4.1.52 adopts jemalloc4 to enhance memory allocation through the PageRun/PoolSubpage allocation strategy. Compared to the original Buddy allocation algorithm, it offers lower internal and external memory fragmentation rates for both small and large memory allocations.
The PageRun/PoolSubpage allocation algorithm compared to the original Buddy allocation algorithm:
-
The default size of a Chunk has been reduced from 16MB to 4MB.
-
The Chunk and Page concepts are retained, with the addition of the Run concept. A Run is a series of contiguous Pages used to allocate Normal (28KB to 4MB) medium-sized memory.
-
Tiny and Small memory blocks are replaced with PoolSubpages, which can span multiple Pages, ranging from 16 bytes to 28KB, with a total of 38 basic allocation sizes.
Let's first examine the efficiency of small memory block allocation with an example of requesting 1025 bytes:
- First, 1025 bytes will be rounded to the nearest PoolSubpage allocation size, which is 1280 bytes.
sizeIdx2sizeTab=[16, 32, 48, 64, 80, 96, 112, 128, 160, 192, 224, 256, 320, 384, 448, 512, 640, 768, 896, 1024, 1280, 1536, 1792, 2048, 2560, 3072, 3584, 4096, 5120, 6144, 7168, 8192, 10240, 12288, 14336, 16384, 20480, 24576, 28672, ...]
-
Then, PoolChunk will determine that the PoolSubPage should contain 5 pages by finding the least common multiple of 1280 bytes and the page size of 8KB, which is 40KB.
-
It allocates 5 contiguous pages from PoolChunk and tracks the allocated elements via bitmapIdx.
-
At this point, the allocation is complete, resulting in an internal fragmentation rate of 1 - 1025 / 1280 = 19.9%.
Thanks to the finer granularity of PoolSubPage, which has been refined from 2 levels to 38 levels, the allocation efficiency of small memory blocks has been significantly improved.
Next, let's examine the allocation efficiency of medium-sized memory blocks, Normal (28KB, 4MB]. Suppose a request is made to allocate 2MB + 1KB = 2049KB of memory from a completely idle PoolChunk:
-
After rounding up 2049KB to the nearest multiple of 8KB, it is determined that 257 pages are needed.
-
PoolChunk finds a run that satisfies the size requirement: Run{offset=0, size=512}.
-
PoolChunk splits the run into Run{offset=0, size=257} and Run{offset=257, size=255}. The first run is returned to the requester, while the second run is added to the free run list (runsAvail).
-
At this point, the allocation is complete, and the internal fragmentation rate is 1 - 2049KB / (257 * 8K) = 0.3%;
Through the PageRun mechanism, Netty can control the memory waste of memory block allocation greater than 28KB, not exceeding 8KB, with an internal fragmentation rate of less than 22.2%.
Assuming an additional 1MB of memory is applied for, the PoolChunk continues to run the same logic, splitting Run{offset=257, size=255} into Run{offset=257, size=128} and Run{offset=385, size=127}. The former is returned to the upper layer, while the latter is added to the list of free Runs. At this point, the external fragmentation rate is 25%. If we were to follow the old Buddy algorithm, in a scenario where the size of the PoolChunk is 4MB, a new PoolChunk would need to be opened, resulting in an external fragmentation rate of 62.5%.
Although the PageRun/PoolSubpage allocation algorithm has a lower internal and external memory fragmentation rate compared to the original Buddy allocation algorithm, it does not compact fragmented memory through Garbage Collection (GC) like the JVM does. This results in scenarios where memory blocks of various sizes are continuously allocated and released, leading to fragmented available runs within a PoolChunk. Over time, the memory fragmentation rate gradually increases, eventually causing an Out Of Memory (OOM) error.
After introducing the Netty memory allocation mechanism and scenarios where memory fragmentation occurs, how does AutoMQ solve the memory fragmentation issue?
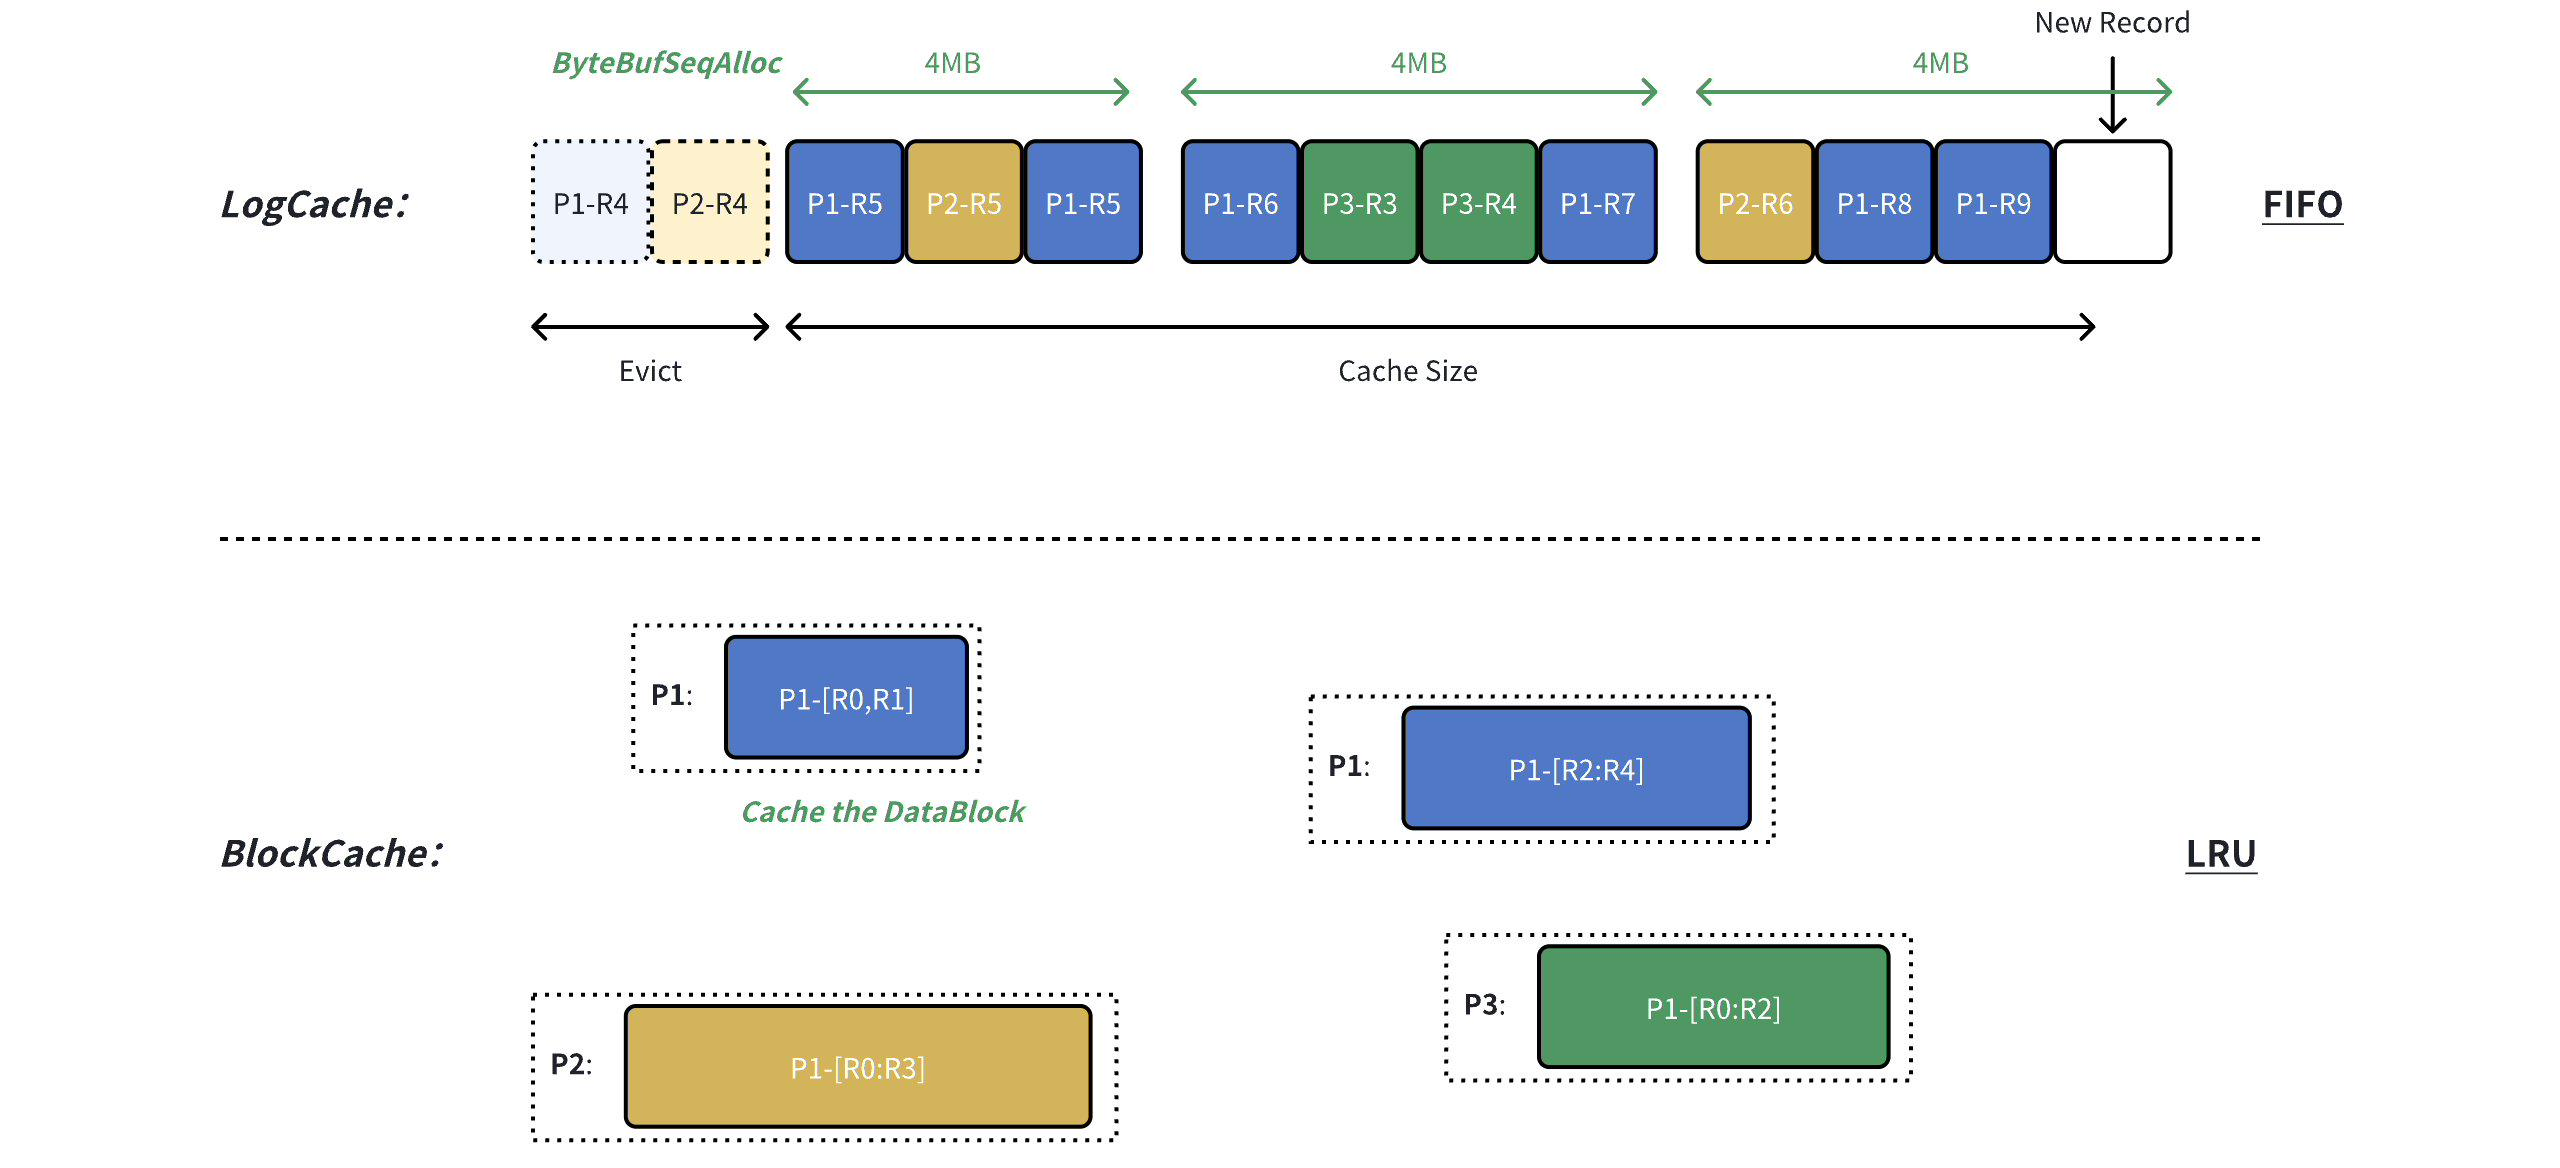
LogCache adopts a first-in, first-out eviction policy to cater to the characteristics of tailing read for continuous access to new data. This means memory allocated at adjacent times will be freed at adjacent times. AutoMQ employs a strategy called ByteBufSeqAlloc:
-
ByteBufSeqAlloc requests ByteBuf of ChunkSize from Netty each time, avoiding external memory fragmentation and achieving zero external memory fragmentation;
-
ByteBufSeqAlloc allocates memory through the underlying ByteBuf#retainSlice, which splits small memory segments from large contiguous memory blocks, avoiding internal memory fragmentation caused by size normalization, achieving zero internal memory fragmentation.
-
When releasing, adjacent blocks are released together. It's possible that most of a block is released while a small portion is still in use, preventing the entire large block from being released. However, this waste occurs only once and will only waste the size of one ChunkSize.
The feature of BlockCache is to pursue high throughput for cold reads, reading large segments of data from object storage. AutoMQ's strategy is to cache large chunks of raw data from object storage:
-
On-demand decoding: Data is decoded into specific RecordBatch only when queried, reducing the number of resident memory blocks and hence minimizing memory fragmentation.
-
Structured splitting: In the future, large cache blocks can be split into structured 1MB memory blocks to avoid increasing memory fragmentation rates caused by continuous allocation and release of various sized memory blocks.
It can be seen that the essence of optimizing LogCache and BlockCache is to avoid memory fragmentation issues brought by Netty's memory allocation strategy through large and structured memory allocations according to the characteristics of their own caches. With this method, AutoMQ maintains an off-heap memory fragmentation rate below 35% in various long-term running scenarios, such as tail reads, cold reads, and mixed message sizes, without encountering off-heap memory OOM issues.
Netty's PooledByteBufAllocator is not a silver bullet; when using it, consider the actual memory space amplification caused by memory fragmentation and plan to reserve reasonable JVM memory size. If Netty is used only as a network layer framework, the memory lifecycle allocated by PooledByteBufAllocator will be relatively short, so the actual memory amplification caused by memory fragmentation will not be significant. However, it is still recommended to upgrade Netty's version to 4.1.52 or above for better memory allocation efficiency. If using Netty's PooledByteBufAllocator for caching, it is recommended to allocate large blocks of memory and then split them continuously to avoid Netty's memory fragmentation.
Reference Document:
- What is automq: Overview
- Difference with Apache Kafka
- Difference with WarpStream
- Difference with Tiered Storage
- Compatibility with Apache Kafka
- Licensing
- Deploy Locally
- Cluster Deployment on Linux
- Cluster Deployment on Kubernetes
- Example: Produce & Consume Message
- Example: Simple Benchmark
- Example: Partition Reassignment in Seconds
- Example: Self Balancing when Cluster Nodes Change
- Example: Continuous Data Self Balancing
-
S3stream shared streaming storage
-
Technical advantage
- Deployment: Overview
- Runs on Cloud
- Runs on CEPH
- Runs on CubeFS
- Runs on MinIO
- Runs on HDFS
- Configuration
-
Data analysis
-
Object storage
-
Kafka ui
-
Observability
-
Data integration


