-
Notifications
You must be signed in to change notification settings - Fork 235
Integrating Metrics with Prometheus
Prometheus is a widely adopted service for monitoring, alerting, and time series data storage. It facilitates the collection, storage, and querying of metrics. This article outlines how to integrate AutoMQ with Prometheus to achieve seamless metrics data collection and querying.
The feature of integrating metrics into Prometheus is only available in the Business Edition of AutoMQ. If you need to evaluate or learn more about the Business Edition, please fill out the form, and our product experts will contact you shortly.
For more information on the differences between the Community Edition and the Business Edition, please refer to Licensing▸.
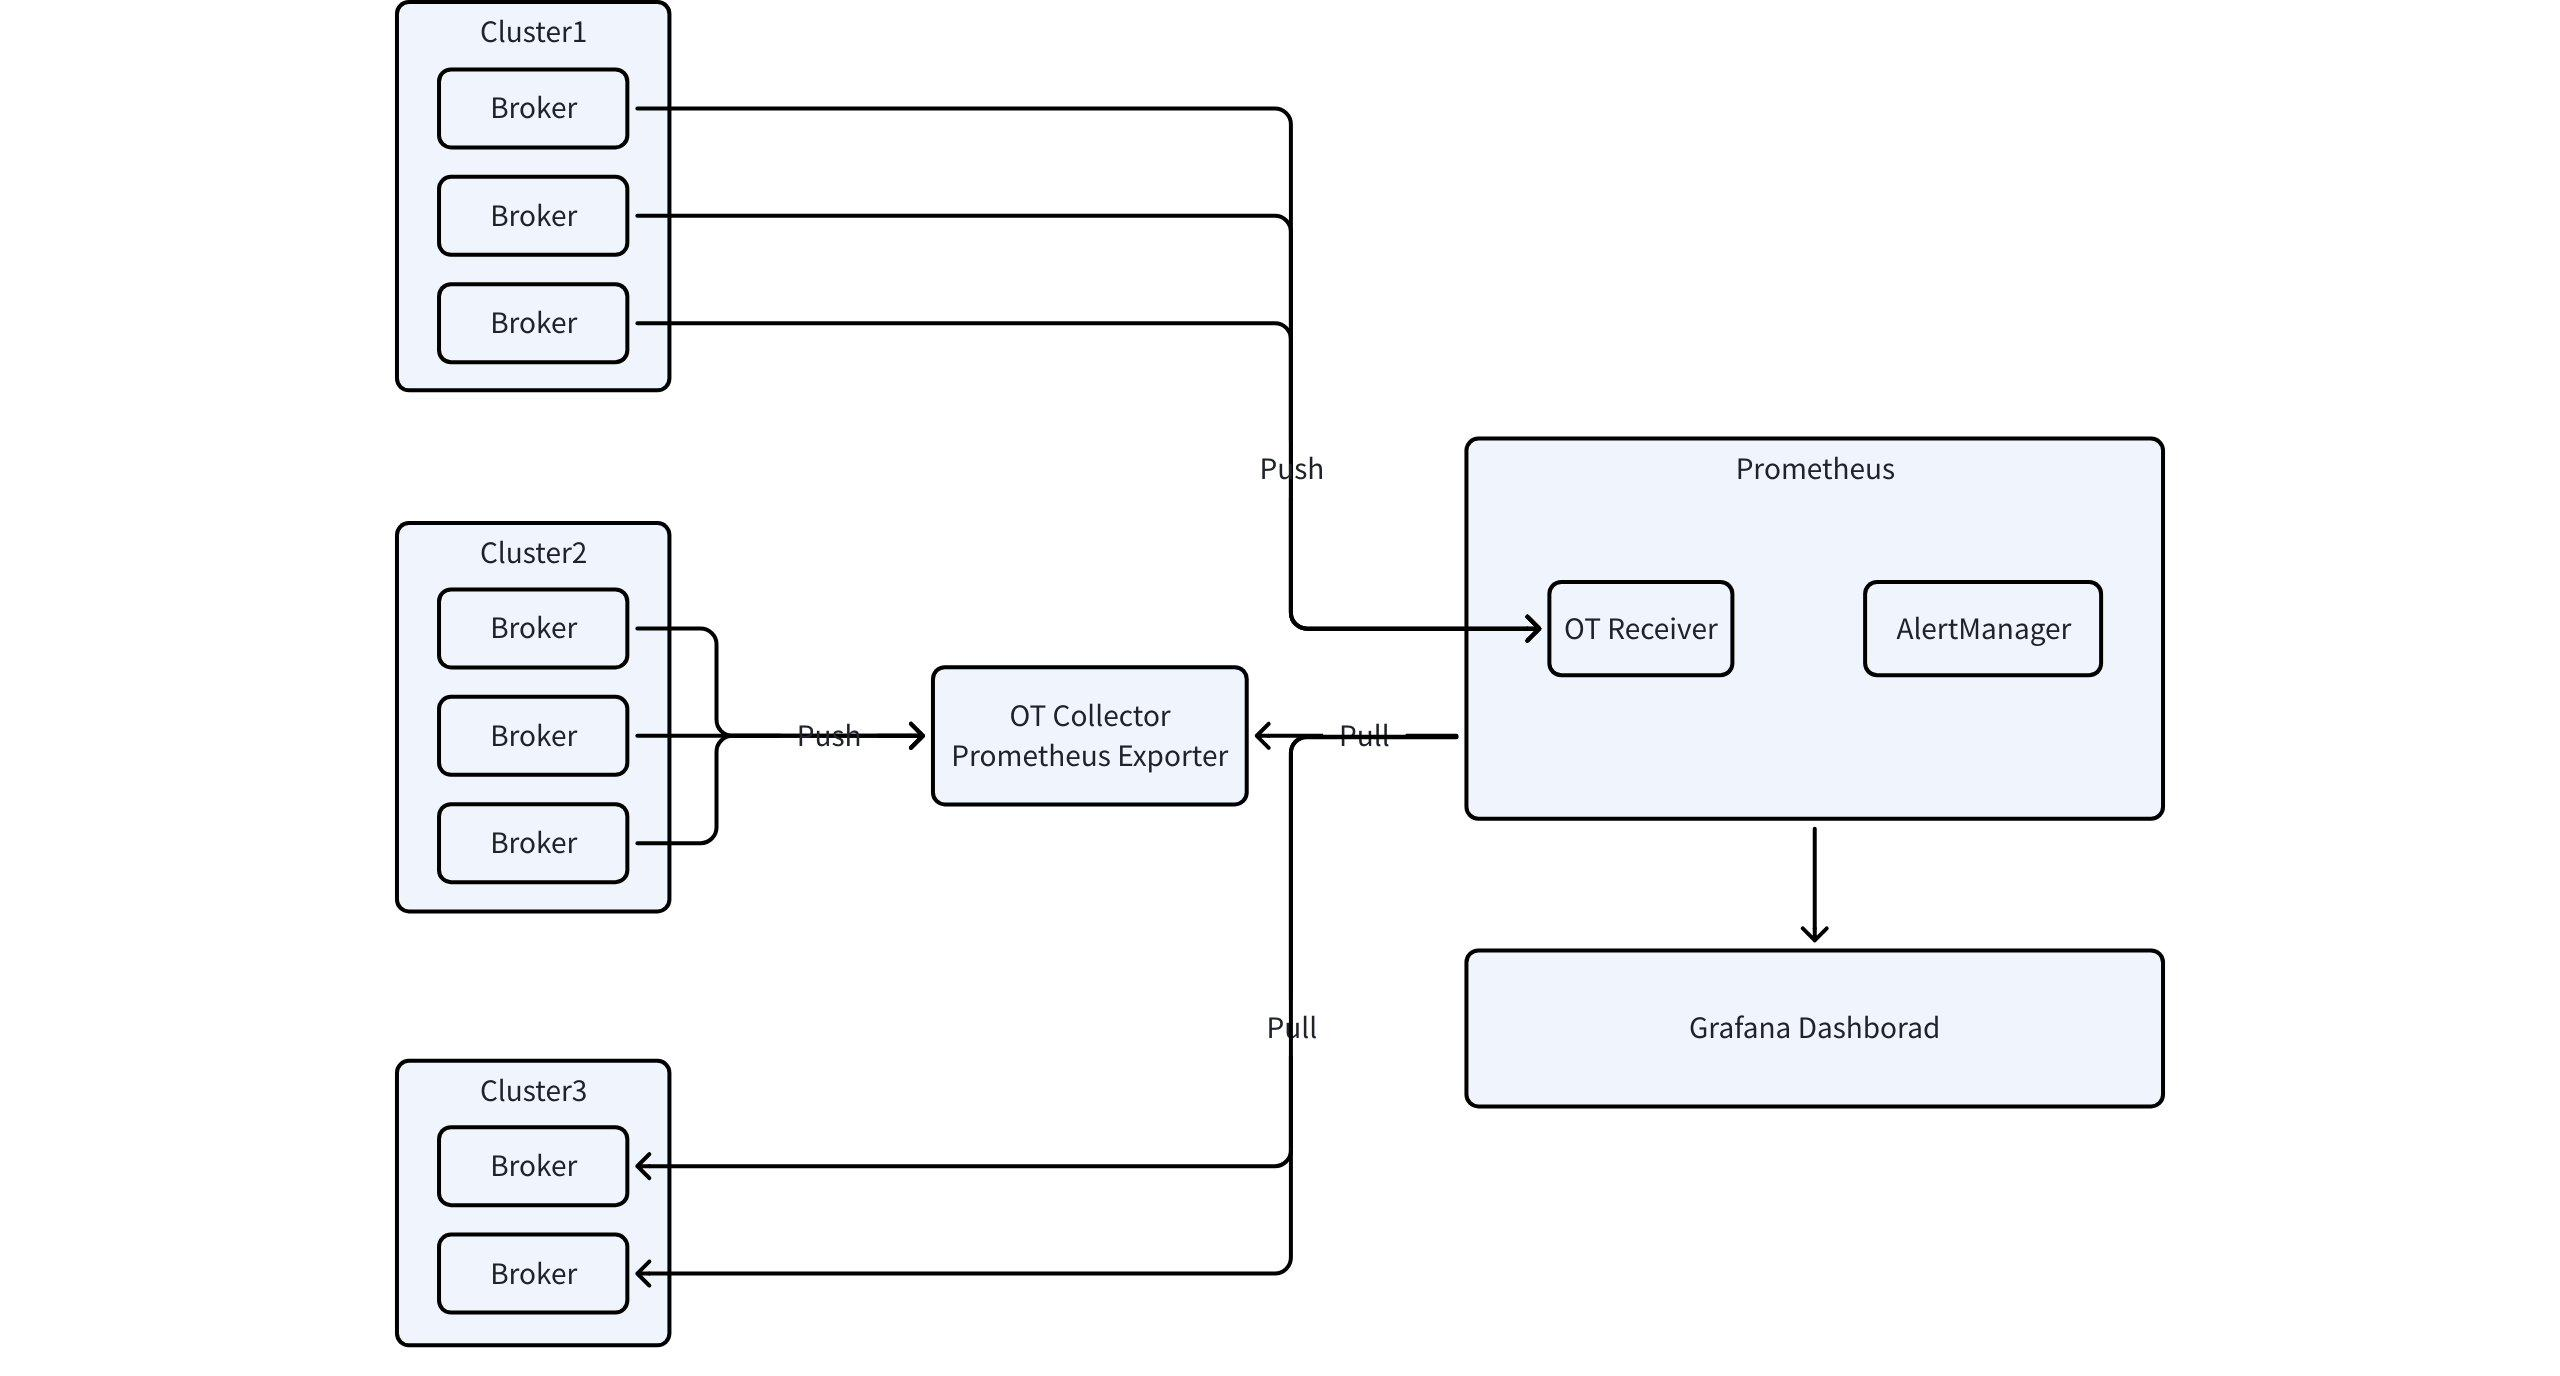
AutoMQ uses the OpenTelemetry SDK to implement metrics collection and export. It supports the exposure of Apache Kafka business metrics and underlying storage-related metrics. Both types of metrics are uniformly converted and exposed using the OTLP format.
For the above figure, first select an appropriate metrics export solution to export metrics data to Prometheus. There are three methods to export metrics data:
-
Using OpenTelemetry Collector
-
Using Prometheus OTLP Receiver
-
Directly Pulling Metrics from the Server
- Start the OpenTelemetry Collector and configure the Prometheus Exporter to collect and export metrics data.
exporters:
  prometheus:
    endpoint: $endpoint_for_promehteus
- When starting the Prometheus service, make sure to add the following configuration.
scrape_configs:
  - job_name: $job_name
    scrape_interval: 5s
    honor_labels: true # DO NOT CHANGE THIS
    static_configs:
      - targets: ["$endpoint_for_prometheus"]
- Configure AutoMQ to push metrics data to the Collector.
s3.telemetry.metrics.exporter.type=otlp
s3.telemetry.exporter.otlp.protocol=grpc
s3.telemetry.exporter.otlp.endpoint=http://${endpoint}:4317

# Or with Http Protocol
# S3.telemetry.exporter.otlp.protocol=http
# S3.telemetry.exporter.otlp.endpoint=http://${endpoint}:4318/v1/metrics
According to Prometheus's version requirements, the user's Prometheus service needs to meet the following conditions:
-
Prometheus version must be at least 2.47.
-
Prometheus needs to enable feature flags: --enable-feature=otlp-write-receiver. Refer to the command below for enabling it.
./prometheus --config.file=prometheus.yml --enable-feature=otlp-write-receiver
If the current self-hosted Prometheus service is based on the VictoriaMetrics Business Edition, ensure that the version of VictoriaMetrics is at least 1.92.0, and configure the access points according to the relevant documentation.
If users are using the commercial version provided by Public Cloud providers, it is recommended to consult the cloud provider's technical support. For instance, Alibaba Cloud's Prometheus service offers out-of-the-box support for the OT protocol. Refer to the OT protocol reporting data documentation.
After starting the Prometheus service, configure AutoMQ to push metrics to Prometheus:
s3.telemetry.metrics.exporter.type=otlp
s3.telemetry.exporter.otlp.protocol=http
s3.telemetry.exporter.otlp.endpoint=http://${endpoint}:9090/api/v1/otlp/v1/metrics

# Or Use with Aliyun Prometheus OpenTelemetry Endpoint
# S3.telemetry.exporter.otlp.endpoint=https://${endpoint}/api/v1/metrics
In this mode, AutoMQ acts as a Prometheus HTTP Server, and users can configure scrape tasks on the Prometheus backend service to fetch Prometheus metrics from specific endpoints. The configuration method is as follows:
s3.telemetry.metrics.exporter.type=prometheus
s3.metrics.exporter.prom.host=127.0.0.1
s3.metrics.exporter.prom.port=9090
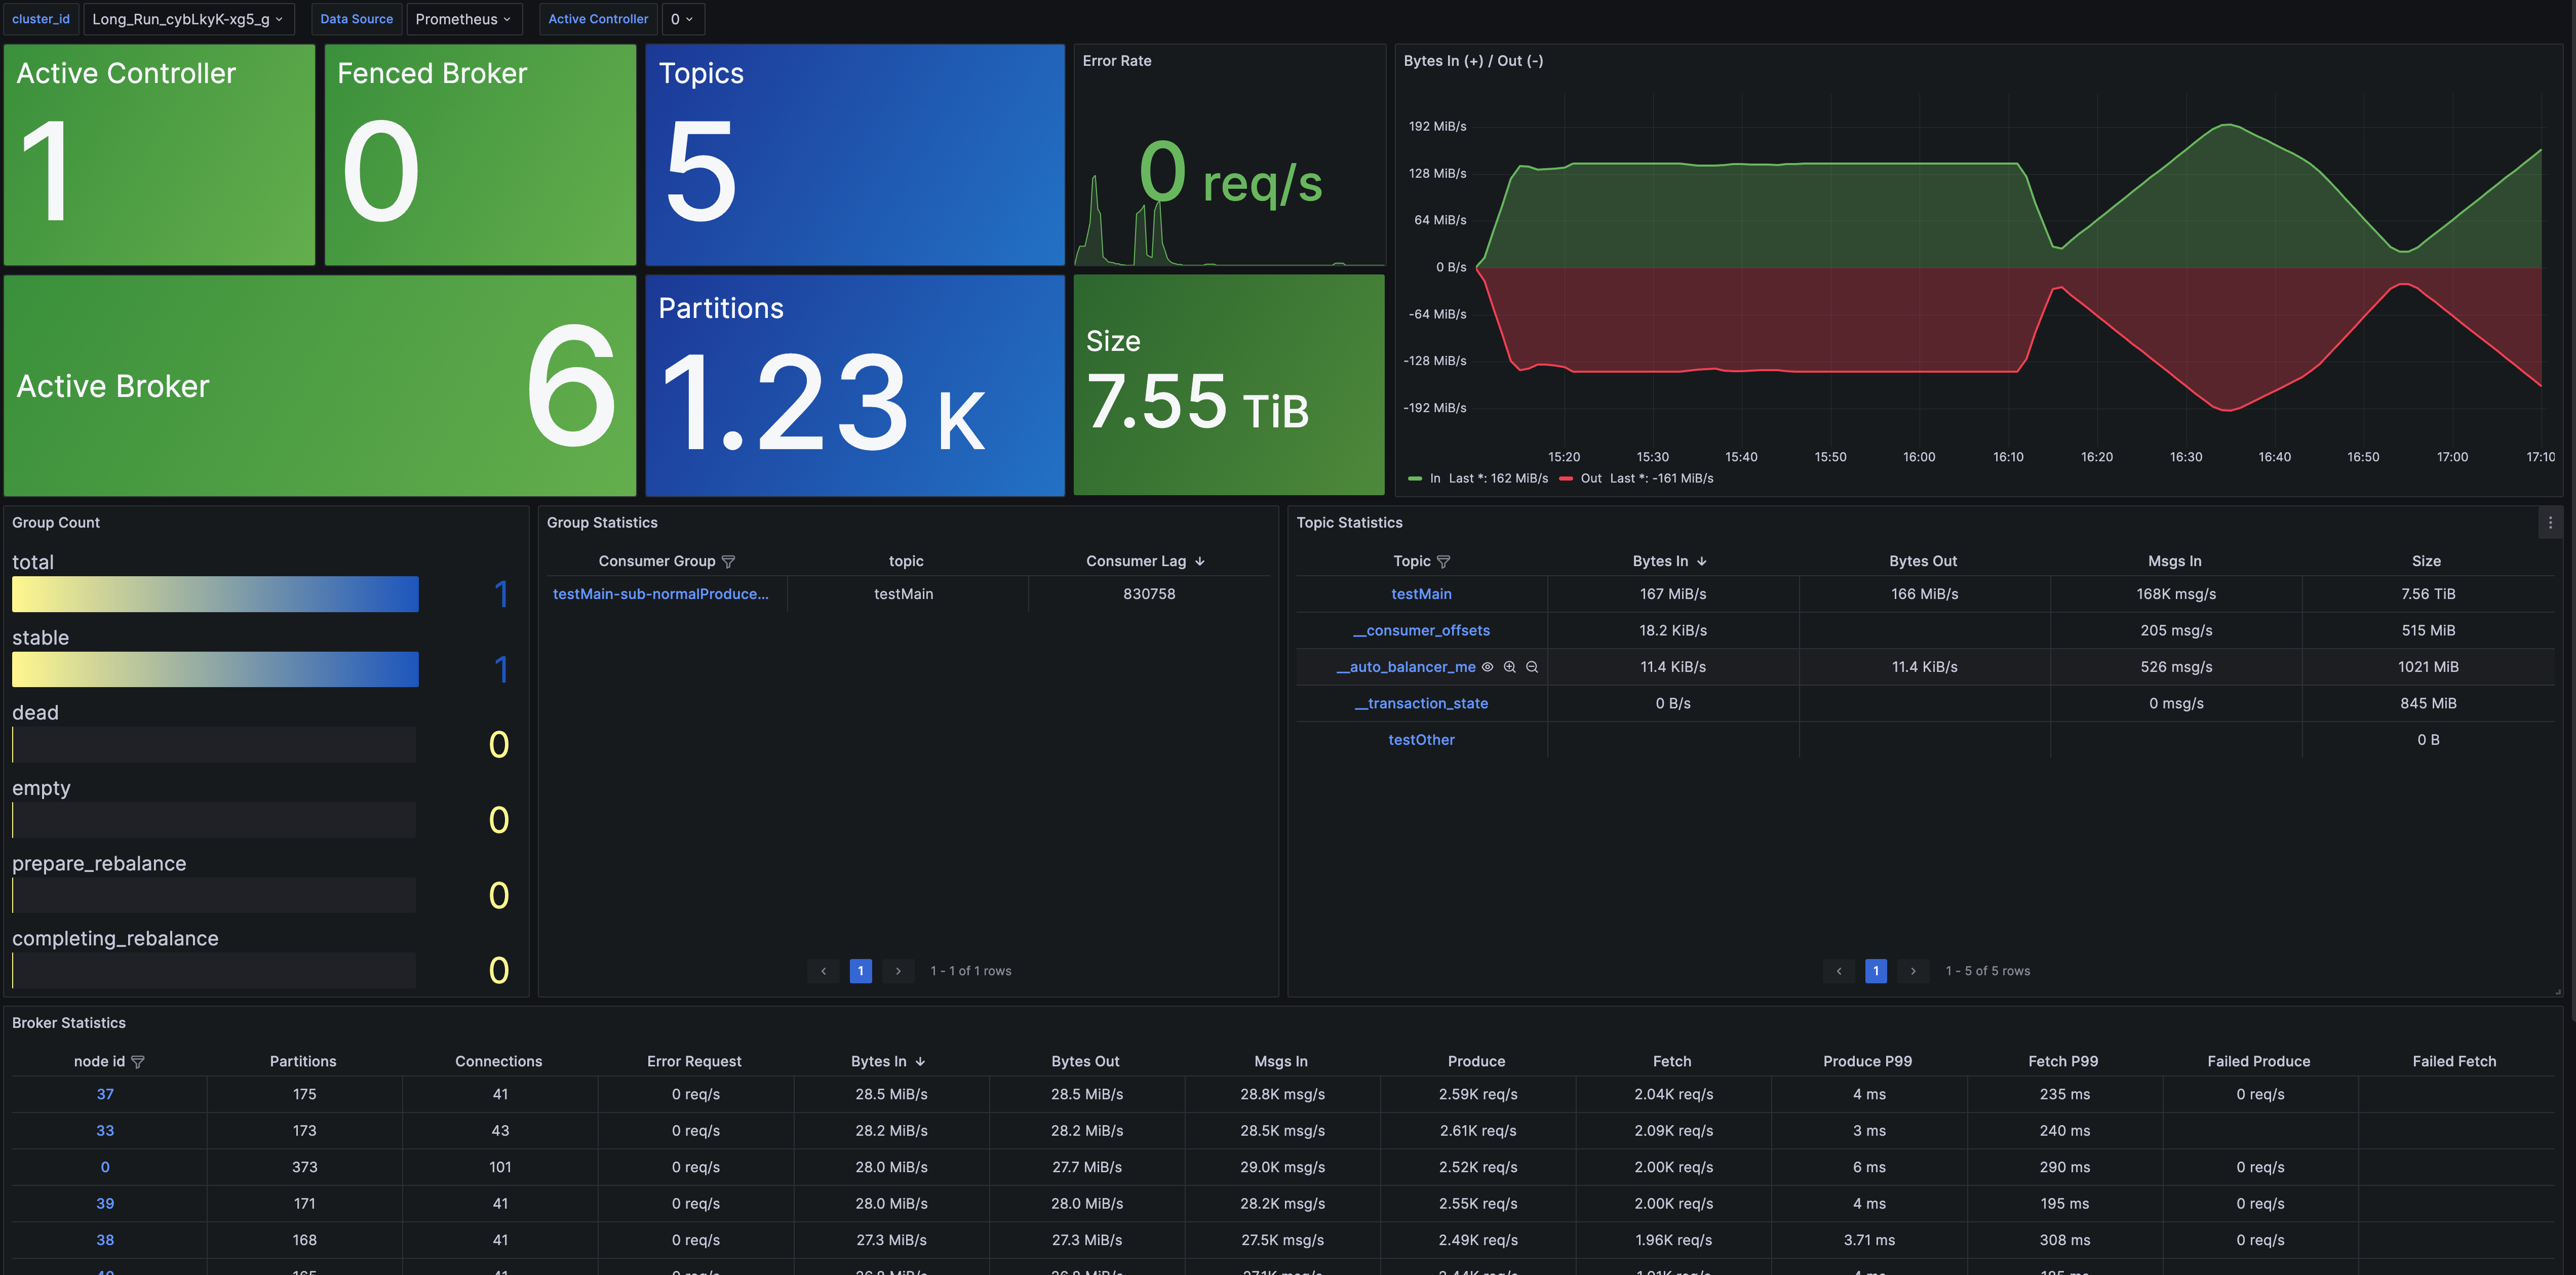
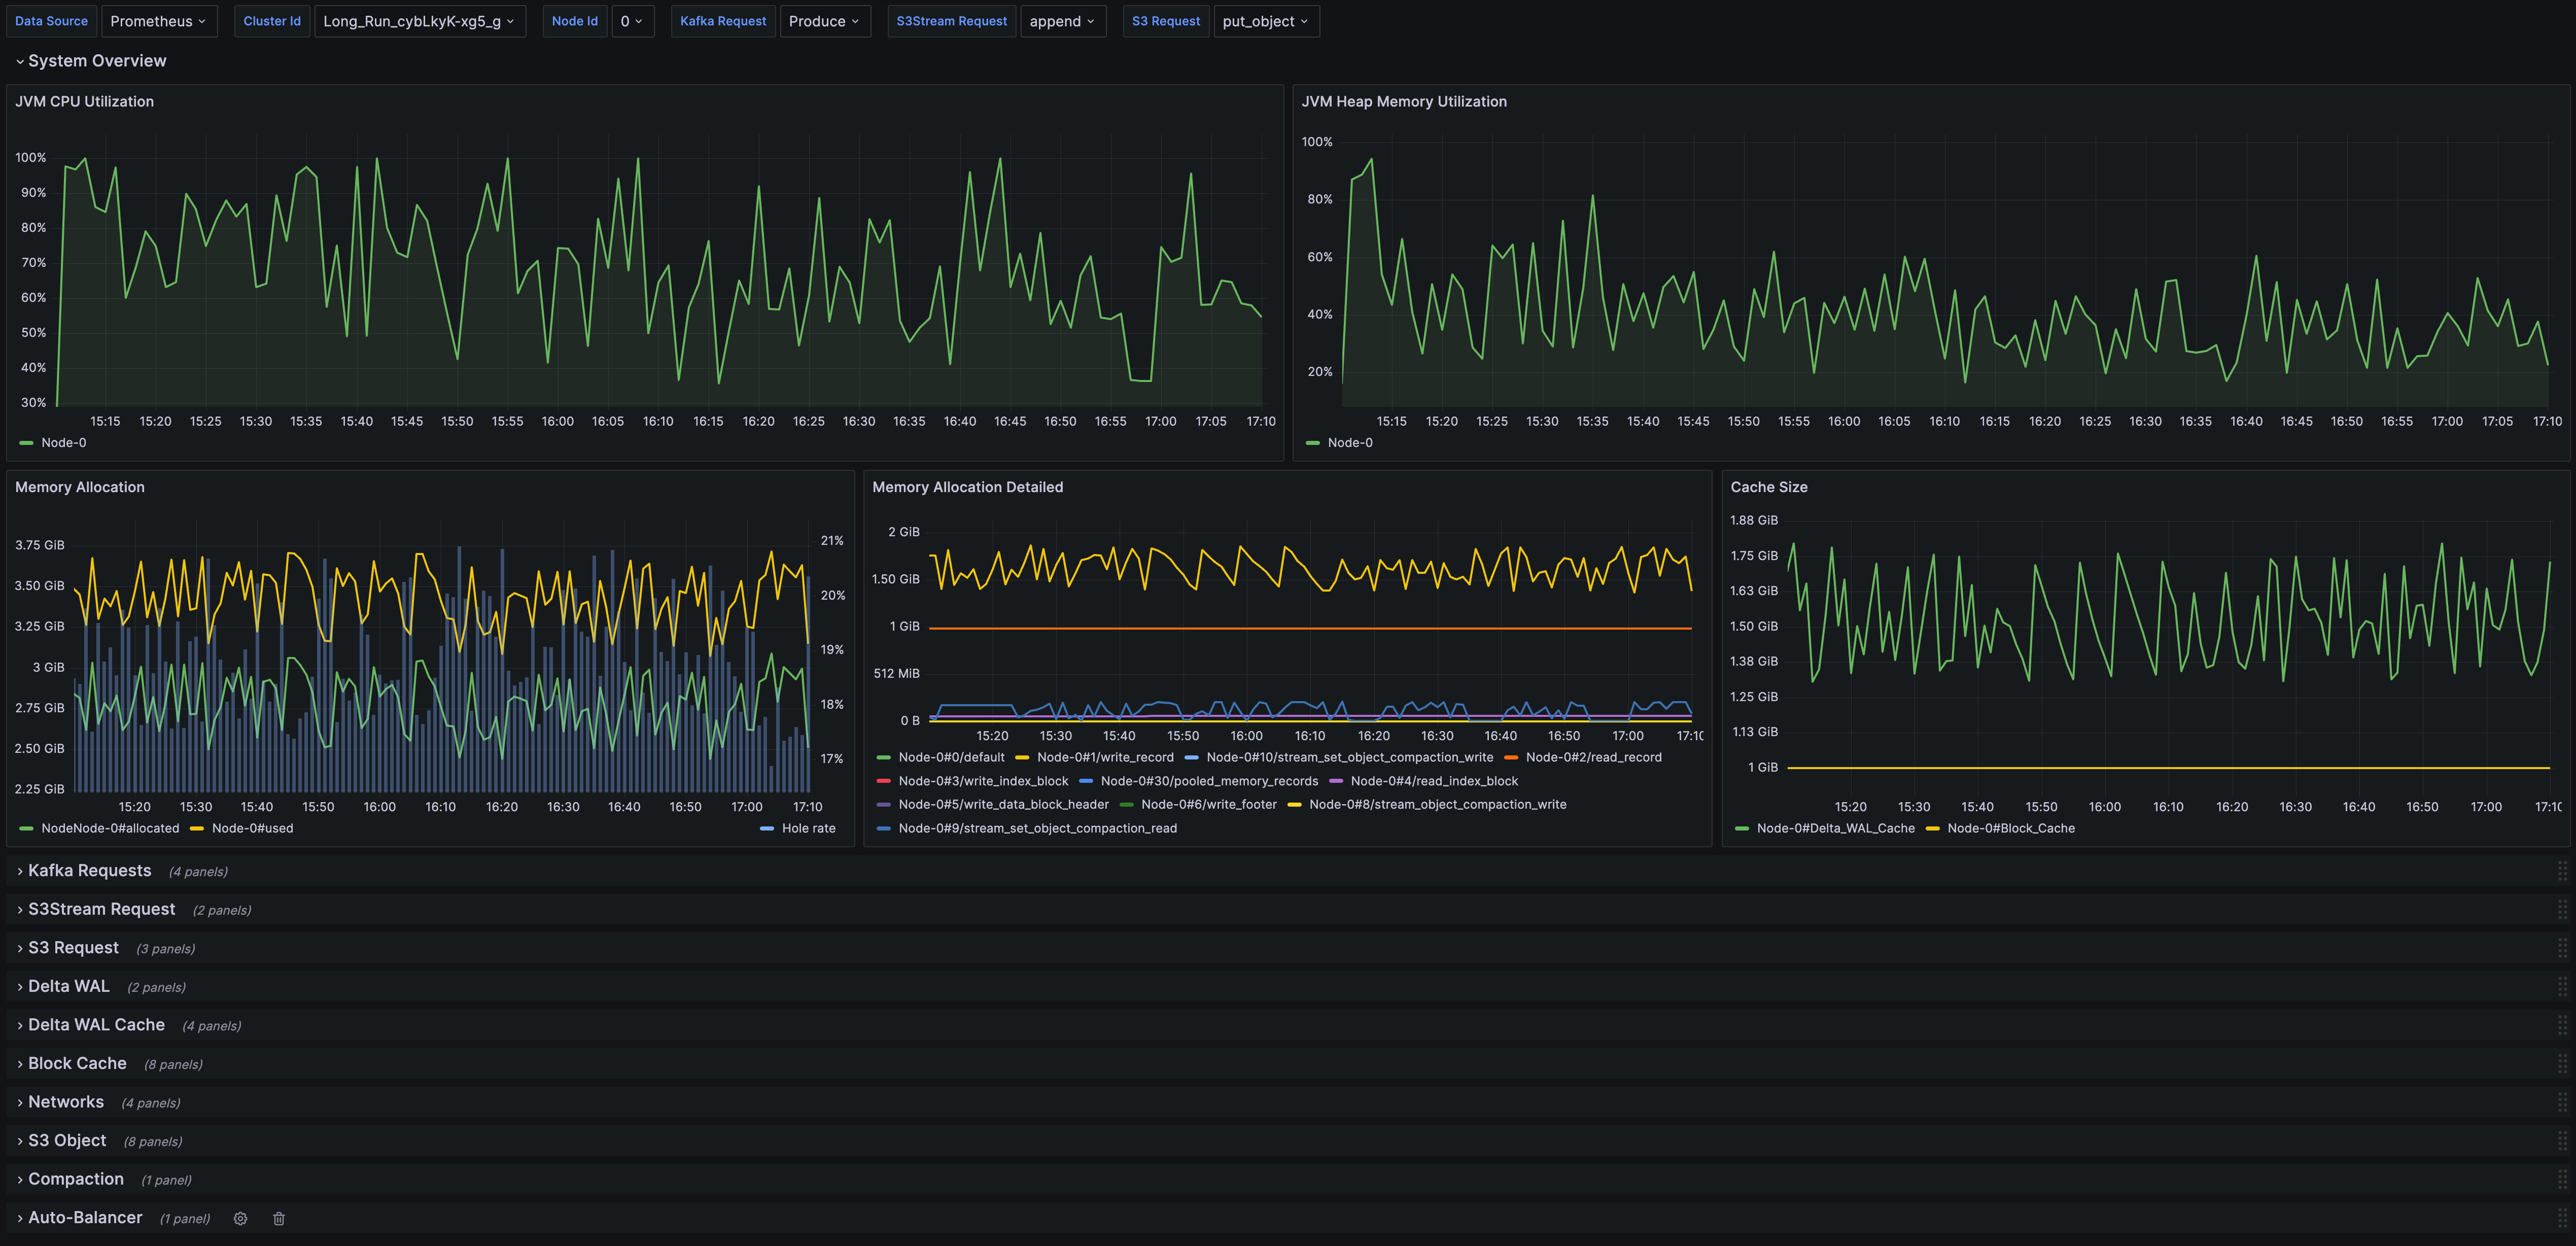
AutoMQ provides preset Grafana dashboard templates (link). After exporting metrics to Prometheus, import the Grafana dashboard templates and configure the Grafana data source to the corresponding Prometheus to start monitoring AutoMQ.
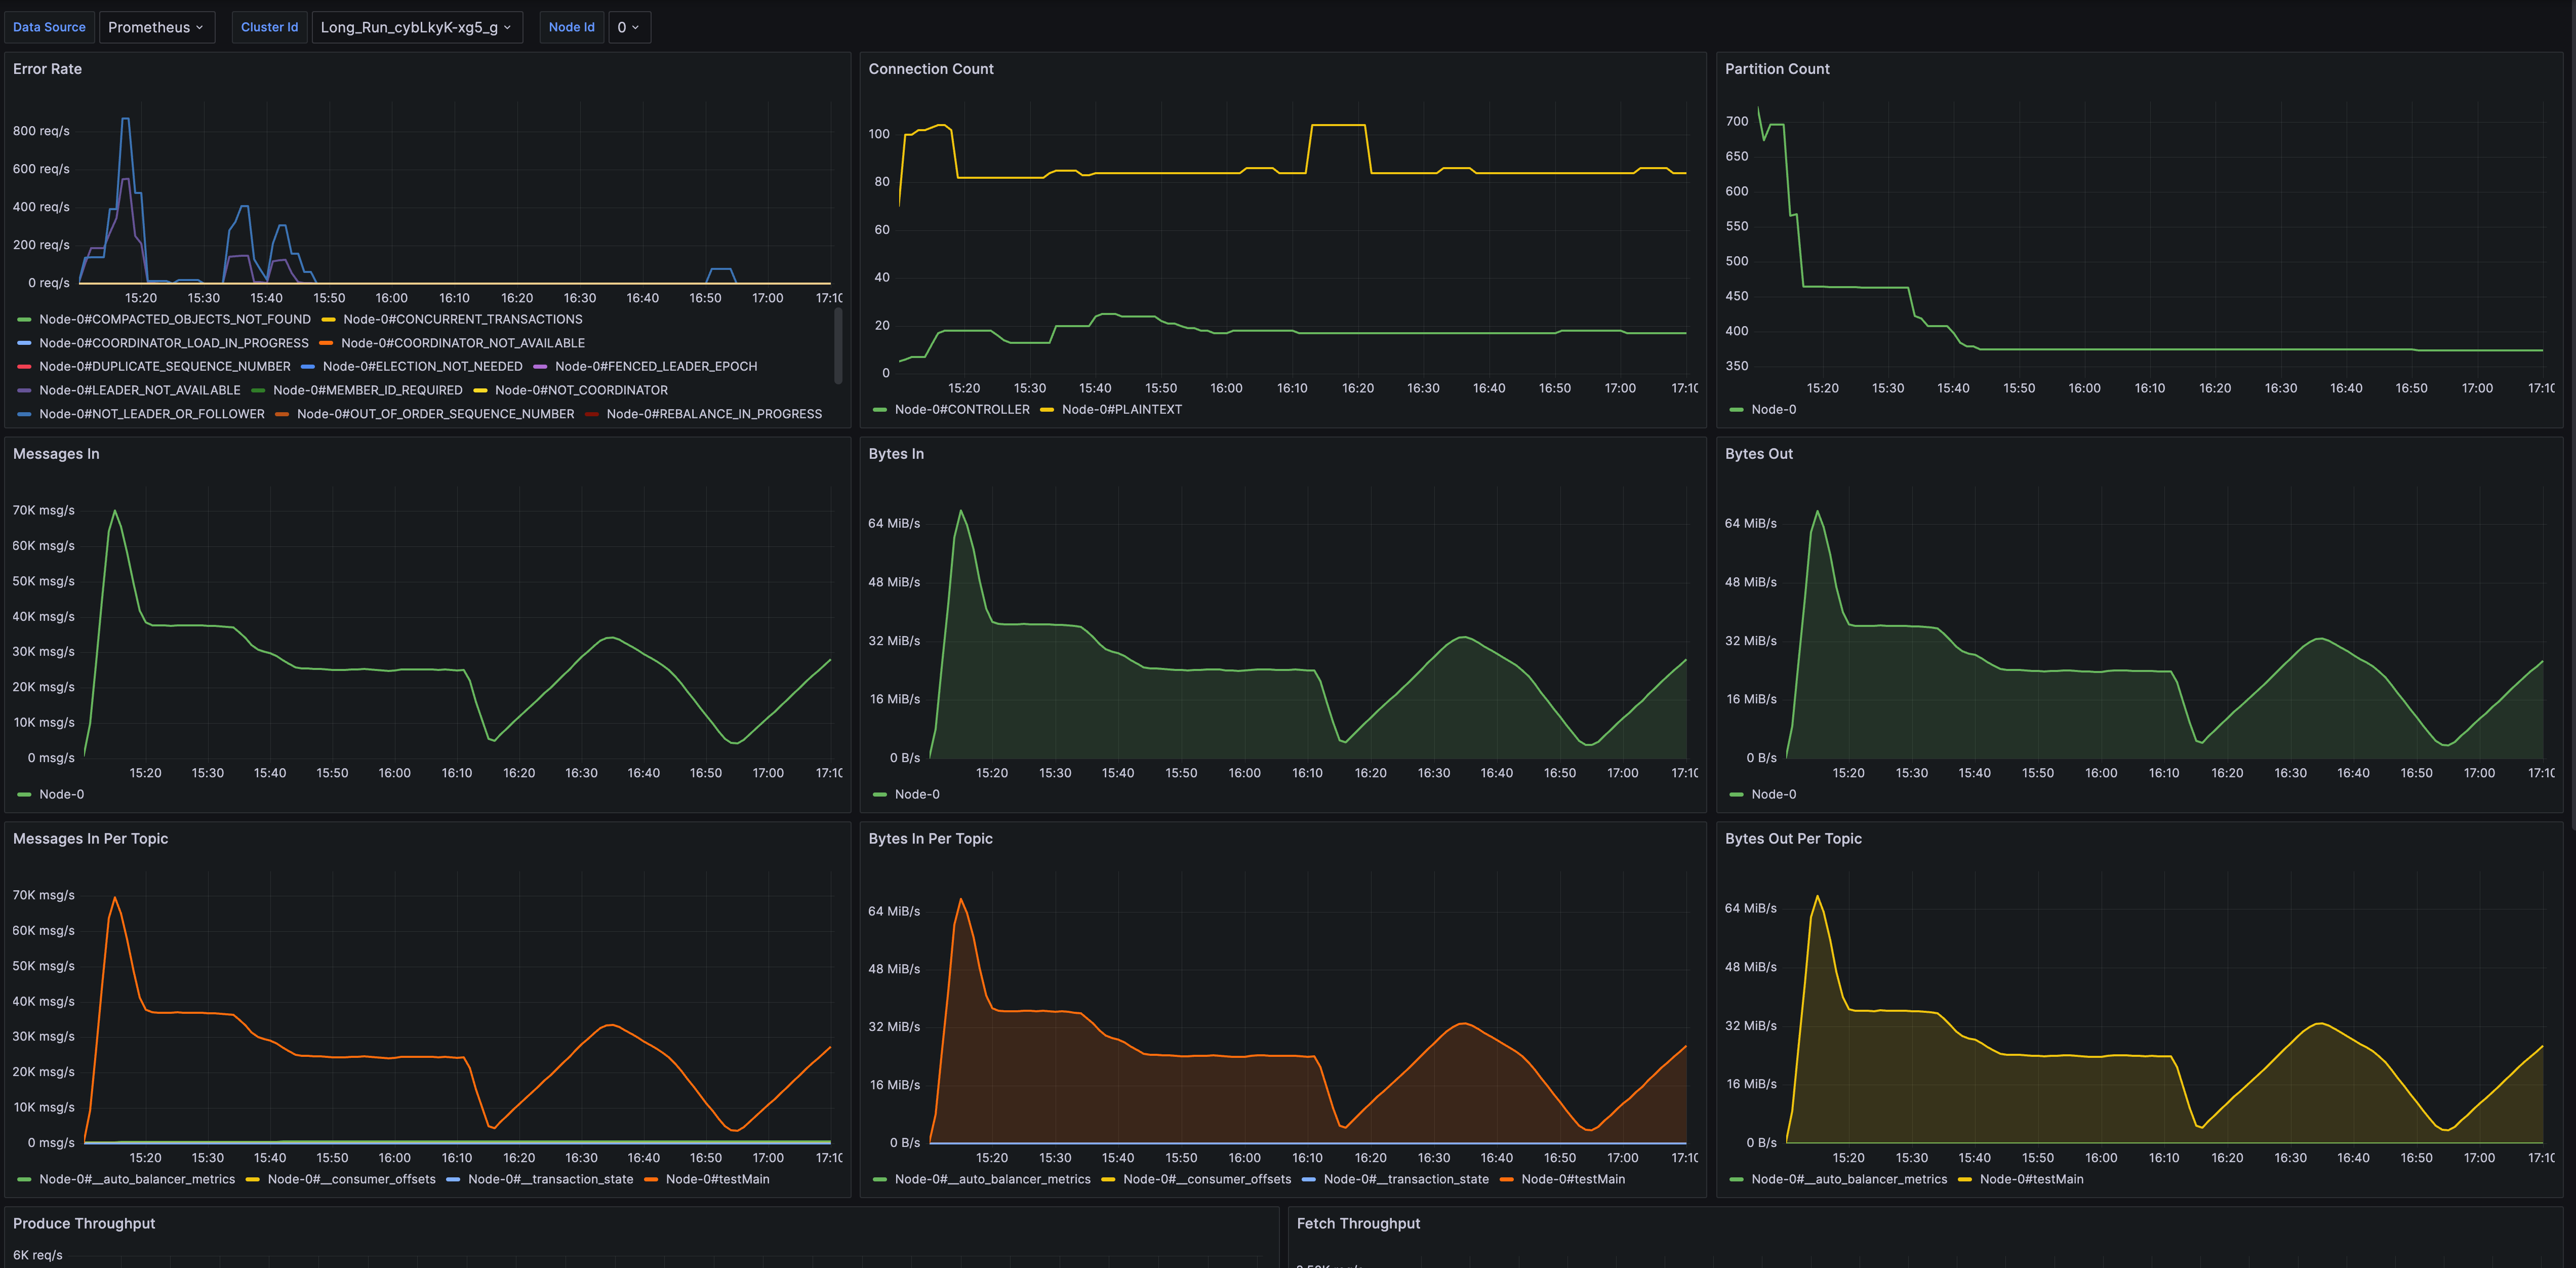
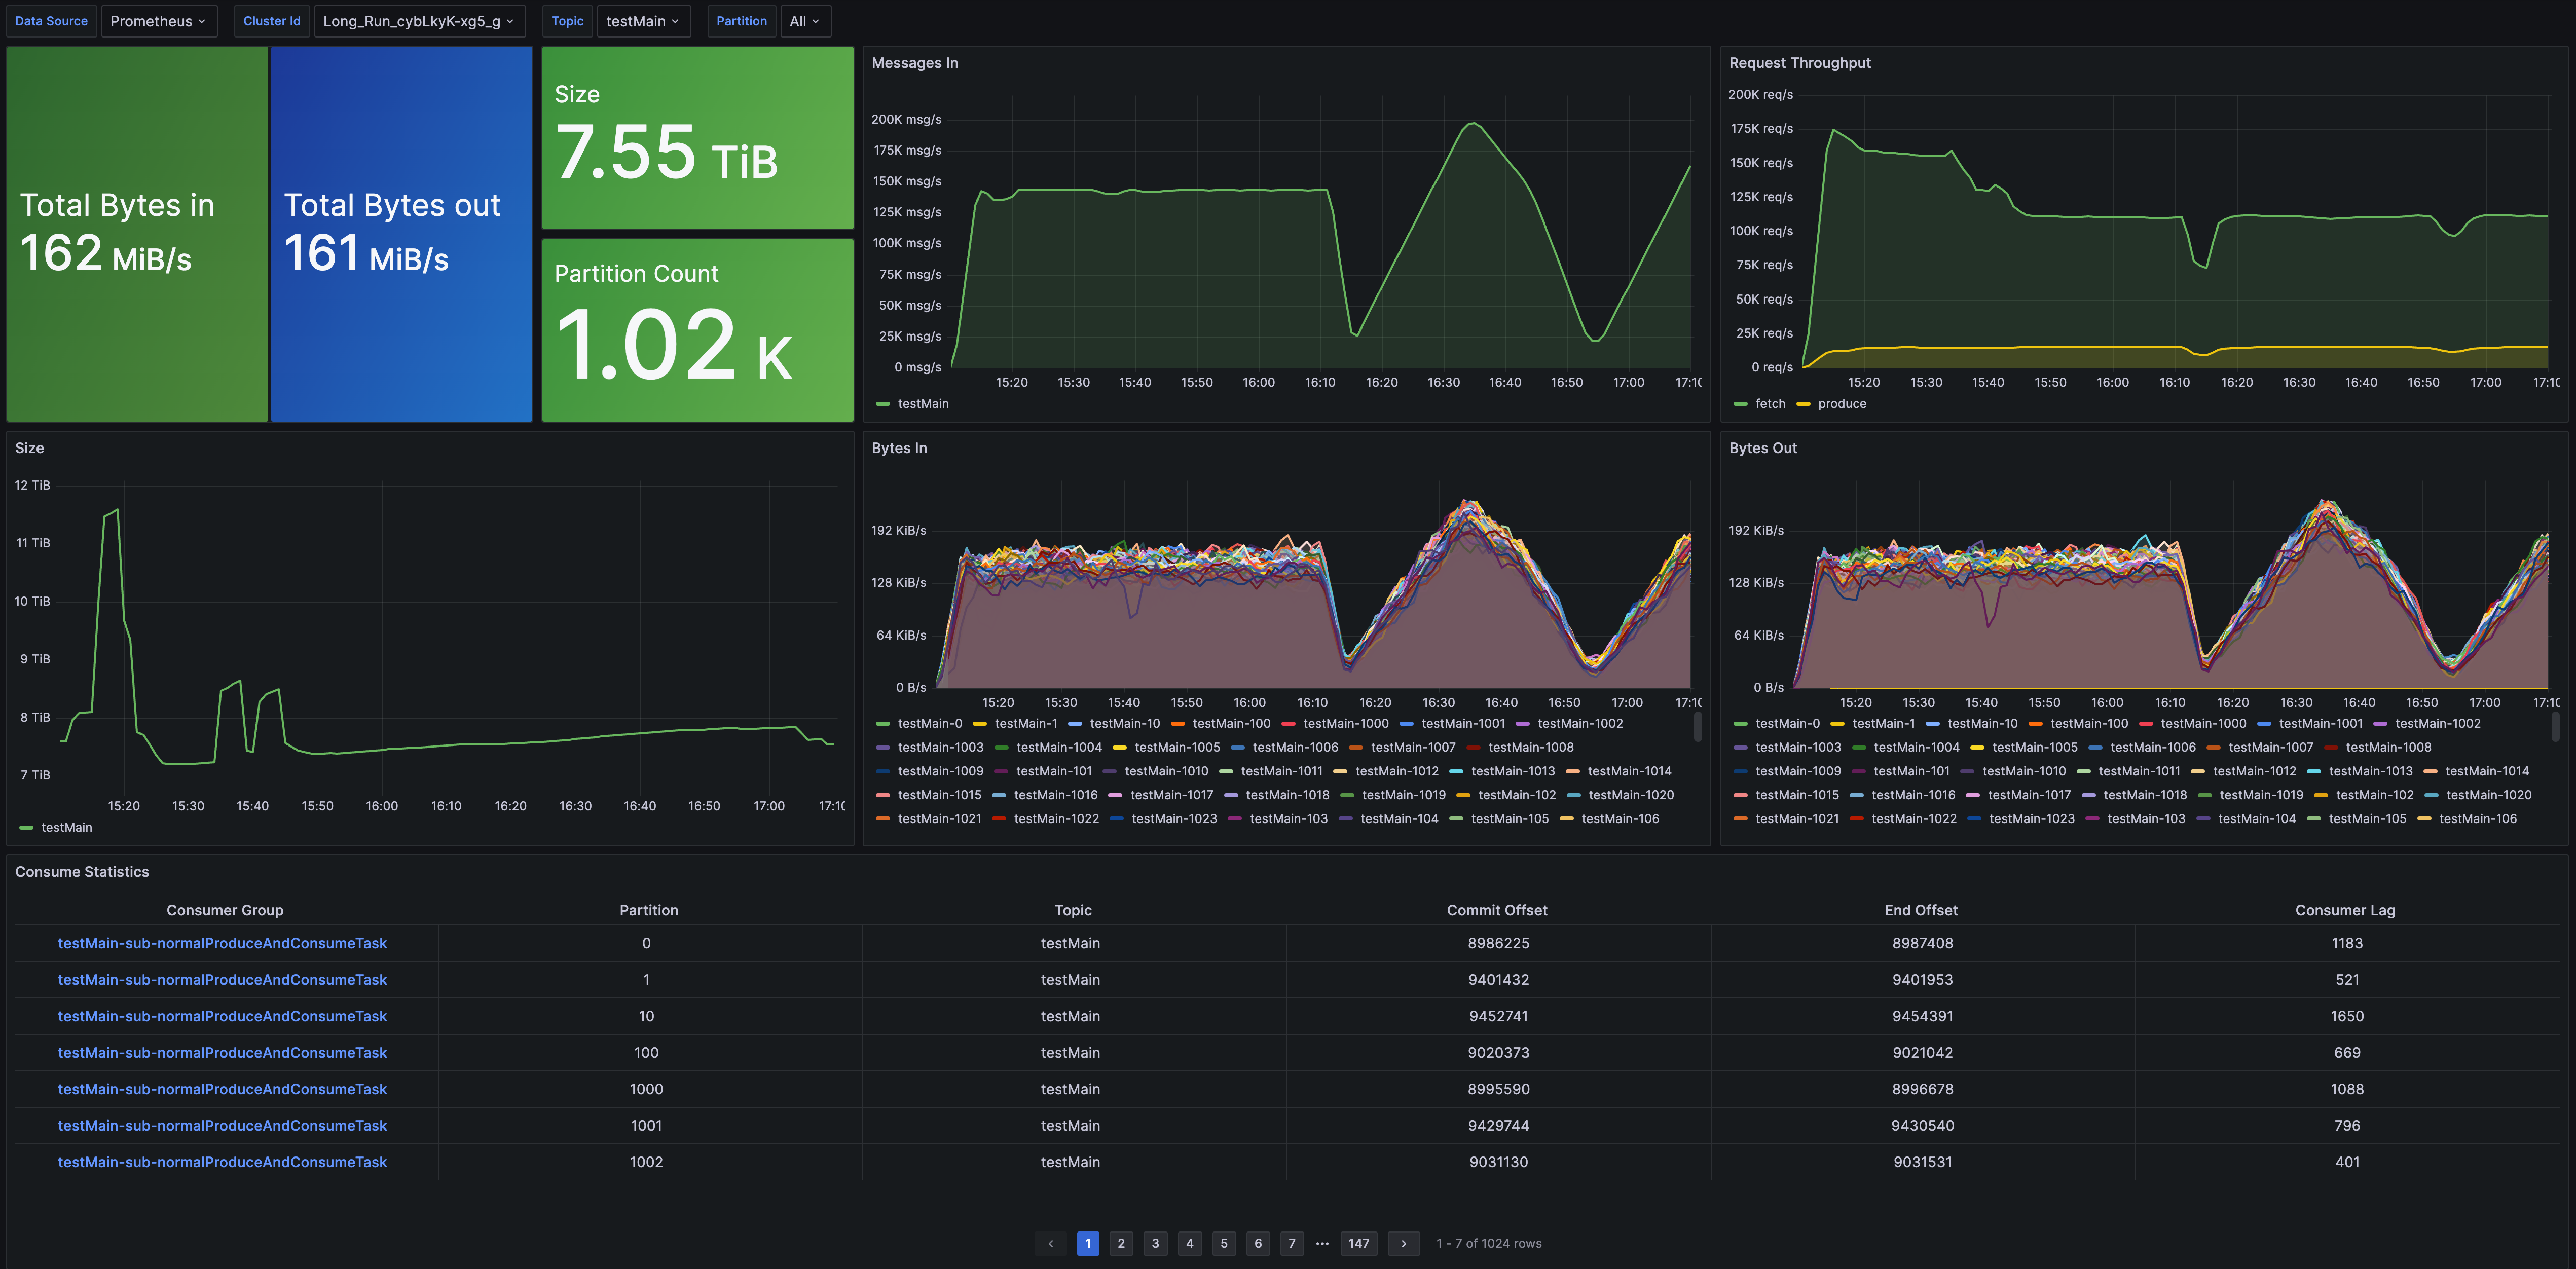
The preset Grafana dashboard templates offer metrics monitoring from different dimensions:
- Cluster Overview: Provides cluster-level monitoring information, including the number of nodes, data size, cluster traffic, and other metrics. It also offers overview metrics for Topic, Group, and Broker dimensions, with drill-down capabilities to view detailed monitoring information.
- Broker Metrics: Offers monitoring data for Brokers, covering metrics such as the number of connections, number of partitions, node traffic, and node requests.
- Topic Metrics: Provides metrics monitoring for Topics, including message throughput, total data volume, number of partitions, and consumption latency.
- Group Metrics: Offers metrics monitoring for Groups, including consumption rate and consumption latency.
- Detailed Metrics: Provides detailed implementation-level metrics monitoring, helping developers in troubleshooting or gaining an in-depth understanding of AutoMQ's operational mechanisms.
- What is automq: Overview
- Difference with Apache Kafka
- Difference with WarpStream
- Difference with Tiered Storage
- Compatibility with Apache Kafka
- Licensing
- Deploy Locally
- Cluster Deployment on Linux
- Cluster Deployment on Kubernetes
- Example: Produce & Consume Message
- Example: Simple Benchmark
- Example: Partition Reassignment in Seconds
- Example: Self Balancing when Cluster Nodes Change
- Example: Continuous Data Self Balancing
-
S3stream shared streaming storage
-
Technical advantage
- Deployment: Overview
- Runs on Cloud
- Runs on CEPH
- Runs on CubeFS
- Runs on MinIO
- Runs on HDFS
- Configuration
-
Data analysis
-
Object storage
-
Kafka ui
-
Observability
-
Data integration
